MaxBCPThreads not causing parallel export

I had recently run into an issue where the MaxBCPThreads value was set to a non-zero value and the Snapshot Agent was still not creating multiple snapshot files for the table in question which was over 70GB in size.

On further inspection, I did find that the issue was with the statistics distribution of the table in question was affecting the parallel file export by the snapshot agent. It has already been documented that the concurrent snapshot generation option prevents the use of parallel BCP threads by the Distribution Agent. This is documented on the ReplTalk blog on MSDN.

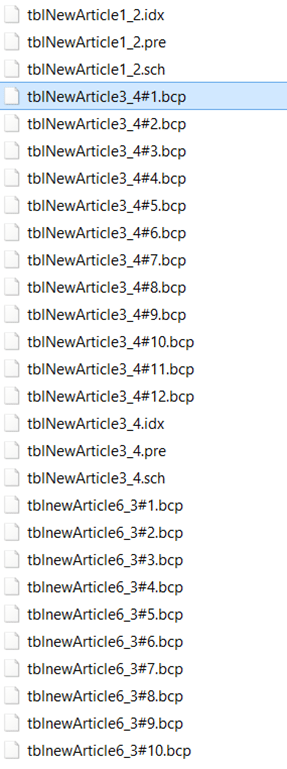
imageNow to find out why the parallel threads were not being generated. So I created a repro of the situation on my side with a transaction replication publication having three tables with the same schema options. The snapshot folder after the snapshot agent’s execution is as shown in the screenshot.

The tblNewArticle6 has 60398 rows, tblNewArticle3 has 100,000 rows and the tblNewArticle1 has 2 rows.

The MaxBCPThreads configured value for the snapshot agent is 6. Surprisingly, tblNewArticle6 has 12 BCP files and the tblNewArticle3 has only one BCP file.

Looking into a profiler trace and the verbose log for the Snapshot Agent, I found out the following information:

1. There is a thread which performs an exploration on what ranges the parallel BCP threads will be fetching. The application name in the profiler trace will show up as “Auxiliary bcp load ordering hint and partitioning resolution thread # for publication <publication name>”. See Screenshot 2 for more details.

2. You will also find dynamic SQL commands executing DBCC SHOW_STATISTICS against the tables in question. image

In my case, tblNewArticle6 has a data distribution graph as shown in screenshot 3. It is clear from the screenshot that the tblNewArticle6 has multiple ranges available for the index id = 1. These were utilized by the Snapshot agent to generate 12 BCP files.


image

On looking into the Snapshot agent verbose log, I find find the following

Partitioning where clauses for article ‘tblnewArticle6’:

([SalesOrderNumber] is null) or ([SalesOrderNumber] <= convert(nvarchar(7), 0x53004F0035003000380034003400) collate SQL_Latin1_General_CP1_CI_AS)
([SalesOrderNumber] > convert(nvarchar(7), 0x53004F0035003000380034003400) collate SQL_Latin1_General_CP1_CI_AS) and ([SalesOrderNumber] <= convert(nvarchar(7), 0x53004F0035003300310039003500) collate SQL_Latin1_General_CP1_CI_AS)


([SalesOrderNumber] > convert(nvarchar(7), 0x53004F0037003300300037003600) collate SQL_Latin1_General_CP1_CI_AS)

The above ranges translated to 12 ranges which is the same number of files that I see in my snapshot folder.

Now looking into tblNewArticle3 which has 100,000 rows, I have a DBCC SHOW_STATISTICS output which only showed me two distinct ranges. Another point to note was that the primary key of the table has a non-clustered index defined on it and the clustered index key is a non primary key column. On increasing the number of rows in the table, I still find that the number of rows in the table, tblNewArticle3, I still found that the number of BCP files that were being generated was only 1. Then on additional investigation, I found that there is a small requirement of the clustered index to contain the primary key columns for the published article as well. This is evaluated in one of the system stored procedures for replication.

Some deep diving into the profiler traces, snapshot agent logs and debugging the stored procedures will help you arrive at the following conclusion:

Multiple BCP files will be created by the Snapshot Agent only if the following are true:

1. There are multiple distinct ranges available in the clustered index’s statistics histogram to create partitions which can be used by the BCP program to extract the data in parallel.

2. The clustered index must be defined on the primary key columns.

3. MaxBCPThreads value is set to a value other than 1.

If the above is true, then you will see multiple BCP files created by the Snapshot agent for the table of interest. Note that the above information is simplified to ensure that I comply with my NDA. After making the above changes, I see the following output in the repldata folder shown below in the screenshot:

image

Additional Reference:
Improving snapshot performance using MaxBCPThreads


Another day at the SQL Bangalore UG Meeting

Another Saturday and another Bangalore SQL UG meeting completed! The turnout on a Saturday morning was really good. This time around the event was a bit different as we had a session on Photography by Vijay [T: @msigeek | B: iClickD]. This week’s User Group meeting was dedicated to SQL Server Tips and Tricks with Balmukund Lakhani [T: @blakhani | B: sqlserver-help] and me presenting on Management Studio and Power Pivot and Power View in Excel 2013.

Balmukund’s session as always was a superb hit where he demonstrated more than a fair share of SSMS tips and tricks. I am sure every one at the event learnt atleast a new thing about SSMS. There are multiple hidden options under the Tools->Options view in SSMS.

Vijay delivered a great session on photography which was very well appreciated by the audience!!

My session was around the the usage of Power View and Power Pivot in Excel 2013. I demonstrated how easy it was to build visualizations with Excel 2013 for administrators. I also demoed the Excel sheet that I had created using the System Health Session data. All my blog posts on this topic are available below.

PowerView and System Health Session–CPU health

PowerView and System Health Session–Scheduler Health

PowerView and System Health Session–SQL Memory Health

PowerView and System Health Session– IO Health

PowerView and System Health Session– System

The Excel file can be downloaded from Sky Drive using the link: http://sdrv.ms/10O0udO The presentation that I used for my session is available at SlideShare and also embedded below.

View query plans with non admin accounts

A question was posted on Twitter’s #sqlhelp hashtag on how to allow non-sysadmin accounts or accounts which do not have the View Server State privilege to fetch the cached query plans. This can be a very big deal if you are a hosting company for databases. You would want to restrict access to all non-admin users but at the same time you might need to give your customers and their developers access to their query plans to assist with their query tuning efforts.

The first thing that comes to mind is to use impersonation in SQL Server. Implementing it is where the fun is!

Let’s consider this hypothetical scenario. I have a SQL Server login named Sentinel which would be granted View Server State privileges only. I have another SQL Server login named Agent which is neither a sysadmin nor a login with View Server State privileges. The Agent login need to look up plans of stored procedures which are executing in the current database.

The first task would be to grant View Server State privileges to Sentinel and impersonate privileges to Agent.

USE [master]

GO

GRANT VIEW SERVER STATE TO [sentinel];

GRANT IMPERSONATE ON LOGIN::[sentinel] to [agent];

GO

Next I create a stored procedure which allows the login agent to see the cached plans which are available for the current database context.

CREATE PROCEDURE [dbo].[usp_SeePlan]

AS

BEGIN

    SET NOCOUNT ON

    EXECUTE AS LOGIN = ‘sentinel’;

    SELECT ‘Executed as user: ‘ + SUSER_NAME()

    SELECT * FROM sys.dm_exec_cached_plans cp

    CROSS APPLY sys.dm_exec_query_plan (plan_handle) qp

    CROSS APPLY sys.dm_exec_sql_text (plan_handle) qt

    WHERE qp.dbid = db_id();

    /* Add your diagnostic query here

    The above query is an example */

    REVERT;

    SELECT ‘Reverted back to user: ‘ + SUSER_NAME()

END

Next when I attempt to grant permissions to the login agent to execute the above stored procedure, I will get the error shown below:

Msg 15151, Level 16, State 1, Line 1
Cannot find the user ‘agent’, because it does not exist or you do not have permission.

This error is reported because there is no database user mapped to the login agent. So I create a database user for agent and grant execute permissions to the login agent for the stored procedure using the commands below:

CREATE USER [agent] FOR LOGIN [agent] WITH DEFAULT_SCHEMA=[dbo];
GRANT EXECUTE ON OBJECT::[usp_SeePlan] TO agent;

Next I will try to execute the stored procedure with the agent login. Everything should work now! But alas.. I get another error as shown below:

Msg 916, Level 14, State 1, Procedure usp_SeePlan, Line 5
The server principal “sentinel” is not able to access the database “Test” under the current security context.

This is because of the fact the login sentinel does not exist in the database Test in which the stored procedure exists. Next I will create a database user mapped to the login sentinel.

CREATE USER [sentinel] FOR LOGIN [sentinel] WITH DEFAULT_SCHEMA=[dbo]

Now when I used the stored procedure, everything works!! Screenshot of the output is shown below.

image
A few other caveats to note is that if the stored procedure is created with the WITH EXECUTE AS option, then on execution of the procedure, you will be reported with the following error:

Msg 297, Level 16, State 1, Procedure usp_SeePlan, Line 8
The user does not have permission to perform this action.

So the summary is the following sequence:

1. Grant impersonate rights to Agent for Sentinel

2. Create a stored procedure which does the work which requires View Server State privilege using the EXECUTE AS LOGIN = ‘Sentinel’ statement

3. Create two database users in the database which are mapped to Agent and Sentinel

4. Grant execute privileges on the stored procedure which was created in Step #2.

Voila… You are now ready to impersonate and view the query plan!

PowerView and System Health Session– System

Previous posts in this series:

PowerView and System Health Session–CPU health

PowerView and System Health Session–Scheduler Health

PowerView and System Health Session–SQL Memory Health

PowerView and System Health Session– IO Health

In the last post for this series, I had explained how to retrieve the I/O statistics from the System Health Session data. In this post, I will describe how to build a dashboard using the SYSTEM component of the sp_server_diagnostics output. This view will help DBAs track various errors which can get their blood pressure shooting to abnormal levels. The SYSTEM component tracks various errors like non-yielding conditions, latch related warnings, inconsistent pages detected and access violations for the SQL Server instance.

Armed with this information in a Power Pivot table, I created two calculated columns for DAY and HOUR on the time the event was reported. After that I created KPIs on the maximum number of non-yielding conditions, latch related warnings, inconsistent pages and access violations reported.

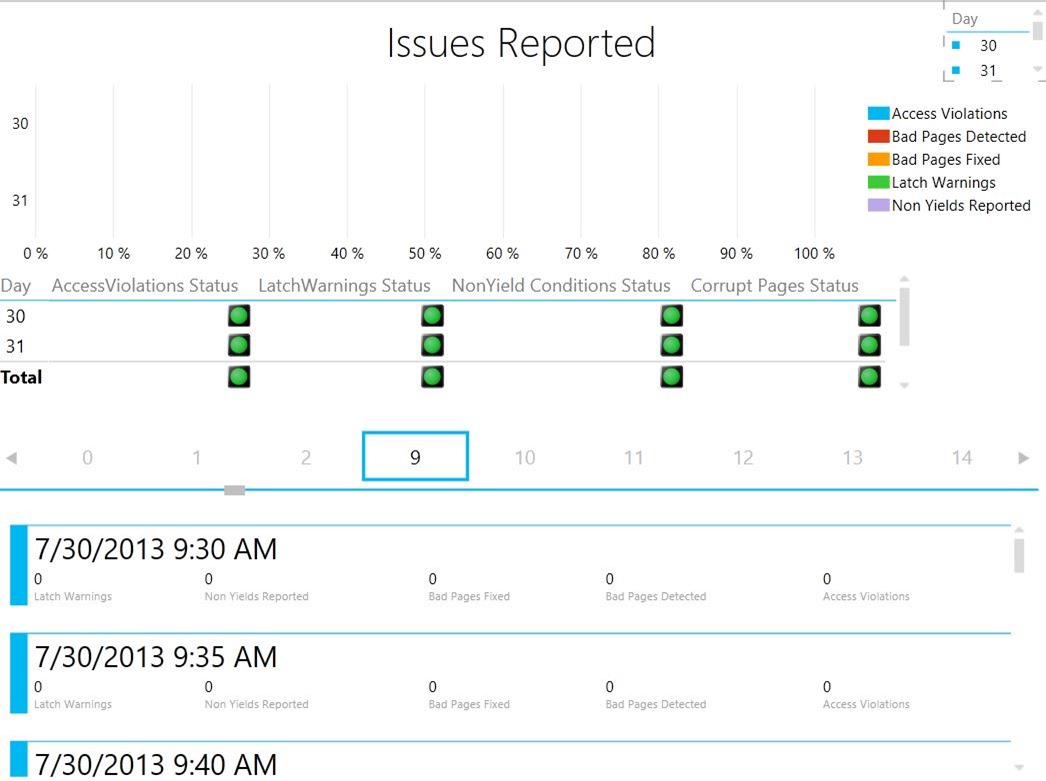
Now that I have my Power Pivot data, I created a new Power View sheet which tracks the created KPIs for each day and hour. The screenshot below shows the final view.

The first half is a 100% Stacked Bar graph showing the various errors that were reported each day. There is a slicer for Day available which allows to filter the data quickly.

The second half of the report is a matrix which shows the KPI status for which day with a drill-down capability for hour.

The third half of the report shows a card view with the actual number of issues reported for each event against a particular time.

As usual the Excel sheet is available on SkyDrive at: http://sdrv.ms/10O0udO

Issue Statistics

The query to fetch the data required to build this report is available below.


SET NOCOUNT ON

-- Fetch data for only SQL Server 2012 instances

IF (SUBSTRING(CAST(SERVERPROPERTY ('ProductVersion') AS varchar(50)),1,CHARINDEX('.',CAST(SERVERPROPERTY ('ProductVersion') AS varchar(50)))-1) >= 11)

BEGIN
-- Get UTC time difference for reporting event times local to server time

DECLARE @UTCDateDiff int = DATEDIFF(mi,GETUTCDATE(),GETDATE());

-- Store XML data retrieved in temp table

SELECT TOP 1 CAST(xet.target_data AS XML) AS XMLDATA

INTO #SystemHealthSessionData

FROM sys.dm_xe_session_targets xet

JOIN sys.dm_xe_sessions xe

ON (xe.address = xet.event_session_address)

WHERE xe.name = 'system_health'

AND xet.target_name = 'ring_buffer';

-- Parse XML data and provide required values in the form of a table

;WITH CTE_HealthSession (EventXML) AS

(

SELECT C.query('.') EventXML

FROM #SystemHealthSessionData a

CROSS APPLY a.XMLDATA.nodes('/RingBufferTarget/event') as T(C)

)

SELECT

DATEADD(mi,@UTCDateDiff,EventXML.value('(/event/@timestamp)[1]','datetime')) as [Event Time],

EventXML.value('(/event/data/text)[1]','varchar(255)') as Component,

EventXML.value('(/event/data/value/system/@latchWarnings)[1]','bigint') as [Latch Warnings],

EventXML.value('(/event/data/value/system/@isAccessViolationOccurred)[1]','bigint') as [Access Violations],

EventXML.value('(/event/data/value/system/@nonYieldingTasksReported)[1]','bigint') as [Non Yields Reported],

EventXML.value('(/event/data/value/system/@BadPagesDetected)[1]','bigint') as [Bad Pages Detected],

EventXML.value('(/event/data/value/system/@BadPagesFixed)[1]','bigint') as [Bad Pages Fixed]

FROM CTE_HealthSession

WHERE EventXML.value('(/event/@name)[1]', 'varchar(255)') = 'sp_server_diagnostics_component_result'

AND EventXML.value('(/event/data/text)[1]','varchar(255)') = 'SYSTEM'

ORDER BY [Event Time];

DROP TABLE #SystemHealthSessionData

END

TroubleshootingSQL Bytes–CPU usage analysis with Excel 2013

A screencast showing the CPU usage statistics of a SQL Server 2012 instance retrieved using Power Pivot. The visualization has been built using Power View in Excel 2013. The nuts and bolts of how the visualization was created is available in the following blog post: PowerView and System Health Session–CPU health

TroubleshootingSQL–CPU usage analysis with Excel 2013