PowerMap – Population of cities in India

In my last post During the September Bangalore UG meeting, I had presented on PowerBI, Power Query, Power Map and Online Search to be specific! In this post, I shall talk specifically about the Power Map feature.

Online Search is an option available in the Power Query tab (screenshot 1) in Excel. Online Search allows you to search public datasets to import data from a large collection of public data sources. Displays the Online Search pane so you can search for public data from Wikipedia. Search results list items that contain the search term anywhere in the title, description, or key words.

image_thumb7

Using online search, I was able to search for a public dataset having the most populated cities in India during 2011. A screenshot of the data is shown below. I am not going to elaborate on how to get the dataset using online search as I had explained that in my earlier post.

image

Now that I had this data, I thought it would be a great idea to represent this in a format which forms an overlay on a map. You will need PowerMap installed before you can use this functionality. Power Map allows you to quickly visualize geospatial data that you have already brought into Excel with Power Query and mashed-up with Power Pivot. Power Map can now be found on the “Insert” tab in Excel for Office 365 ProPlus customers. Subscription customers will have access to all the new and upcoming features of Power Map. See screenshot below.

image

When you launch the Power Map add-in using the “Launch Power Map” drop-down option, you will have the option of creating a new tour or editing an existing tour. The new workspace will provide you options to:

1. Add a new layer and modify it

2. Modify the scene options and animations

3. Define the scale for the visualizations and the type of visualization

4. Define the type of maps being used

The screenshot below shows the work surface. You can see that I have multiple scenes added in my tour.

image

The final video of the PowerMap demo is available below. And all this took me less than 15 minutes! The file is available on OneDrive.

References:

PowerMap
http://blogs.msdn.com/b/powerbi/archive/2014/02/25/power-map-for-excel-now-generally-available-automatically-updated-for-office-365.aspx

PowerBI – Online Query

This is quite a late post for a presentation that was done in September. But as they say, better late than never! During the September Bangalore UG meeting, I had presented on PowerBI, Power Query, Power Map and Online Search to be specific! In this post, I shall talk specifically about Online Search using Power Query.

Online Search is an option available in the Power Query tab (screenshot 1) in Excel. Online Search allows you to search public datasets to import data from a large collection of public data sources. Displays the Online Search pane so you can search for public data from Wikipedia. Search results list items that contain the search term anywhere in the title, description, or key words.

image

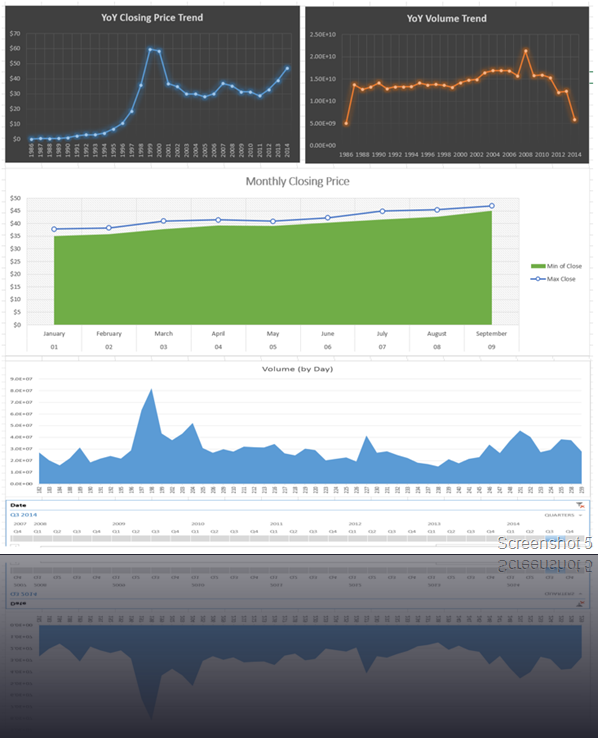
imageWhen you click on the Online Search button, you will be present with a search column which allows you to search for data sets online. Before you can do that, you will need to sign in using an account which can utilize PowerBI features. For this blog post, I will be using the Online Search to create a trending chart for Microsoft (MSFT) stock prices.

I used the search string “MSFT Stock” which gave me a list of stock quotes available online. You will be presented with two sets of data:

a. From your organization if you have signed in using your Organizational Account and if someone from your organization has shared dataset pertaining to your search string

b. Publicly available datasets which match your search string

The mouse over on the data set (Screenshot 2) will show you multiple things like a sample view of the data, the columns and the data source details.

If you think that the data set is good to use, you can use the Load drop-down option to load the data into a data model or into an Excel sheet (See Screenshot 3).

image

Once you have loaded the data as per your choice, you can cleanse and transform your data using Power Query – Query Editor (see Screenshot 4). Once you have created the necessary transformations, you can create pivot charts and pivot tables using the data. The finished product is shown in Screenshot 5.

I had used a Time dimension from the Azure marketplace to prepare my X-axis that you see in the graphs. How that was done is a topic for another post. Once I had all the relationships built, I was able to build the visualizations shown below. All this took me less than 15 minutes! Smile It is that quick provided you have a decent net connection.

Now here is the awesome part. Going to Data -> Refresh, you can refresh all your data and get the latest view without having to re-design anything again. So this is all ready to be published or shared with anyone you want without worrying if they know how to use Power Query or not!

The Excel file is available on One Drive as well.

As you can see from this post, it is quite easy to create visualizations which provide vital insights using Excel 2013 and Power Query within minutes! Look forward to posts in the future on this topic.


image

image

References:

Power Query Ribbon
http://office.microsoft.com/en-ca/excel-help/guide-to-the-power-query-ribbon-HA103993930.aspx

Default Trace–Performance Issues

There are multiple events that a default trace in SQL Server 2005 and above tracks which can be significantly useful for finding out areas of improvement. The events that I will be concentrating on are:

1. Missing Column Statistics – This event class indicates that column statistics that could have been useful for the optimizer are not available due to which an incorrect cardinality estimation could occur. This can cause the optimizer to choose a less efficient query plan than expected. You will not see this event produced unless the option to auto-create statistics is turned off.

2. Missing Join Predicate – This event class indicates that a query is being executed that has no join predicate. (A join predicate is the ON search condition for a joined table in a FROM clause.) This could result in a long-running query. This event is produced only if both sides of the join return more than one row.

3. Sort Warnings – This event class indicates that sort operations do not fit into memory. This does not include sort operations involving the creation of indexes, only sort operations within a query (such as an ORDER BY clause used in a SELECT statement). The EventSubClass field in this event shows whether this was a single pass or a multiple pass. A single pass (EventSubClass = 1) is when the sort table was written to disk, only a single additional pass over the data was required to obtain sorted output. A multiple pass (EventSubClass = 2) is when the sort table was written to disk, multiple passes over the data were required to obtain sorted output. A multiple pass is an enemy of query performance.

4. Hash Warnings – This event class can be used to monitor when a hash recursion or cessation of hashing (hash bailout) has occurred during a hashing operation.  Hash recursion (EventSubClass = 0) occurs when the build input does not fit into available memory, resulting in the split of input into multiple partitions that are processed separately. Hash bailout (EventSubClass = 1) occurs when a hashing operation reaches its maximum recursion level and shifts to an alternate plan to process the remaining partitioned data. Hash bailout usually occurs because of skewed data. Another enemy of performance!

5. Server Memory Change – This event class occurs when Microsoft SQL Server memory usage has increased or decreased. You can even determine what is the current memory usage after the increase or decrease.

6. Log File Auto Grow – This event class indicates that the log file grew automatically. This event is not triggered if the log file is grown explicitly through ALTER DATABASE. Frequent log file growths are not food for performance.

7. Data File Auto Grow – This event class indicates that the data file grew automatically. This event is not triggered if the data file is grown explicitly by using the ALTER DATABASE statement.

Since this information is already available in the default trace, I decided to use my Default Trace Statistics Power View Excel sheet to track this information graphically. And this is what I got (see screenshot 1)!

DefaultTrace_PerfIssues

So what is the above Excel sheet displaying?

1. The information available in the first column chart will show the Data and Log file grow events per database.

2. The first matrix in the middle of the Excel sheet shows the number of Sort Warnings and Hash Warnings with drill-down capabilities for each database to see the EventSubClass fields.

3. The second matrix shows the Missing Column Statistics and the Missing Join Predicate events for each database. The drill-down capability gives the name of the column statistics that was missing.

4. The line graph shows the change in memory for the SQL Server database engine.

Happy monitoring!

Previous posts in this series:

Schema Changes History Report

Twitter Hashtag analysis using Excel 2013

Recently I had written a blog post on my non-SQL Server blog on an event that was being organized world wide to raise awareness to help end violence against women. As with today’s events, the social media was used to garner support and spread the word. There was even a live twitter feed that was running for the #RingTheBell hashtag!

The campaign’s name is Bell Bajao, which in Hindi literally means Ring the Bell started with showing how domestic violence can be prevented by simply ringing the door bell.

The event at Delhi took place at the British council on 8th March, 2013. I used the Tweet Archivist service to start a Tweets archive so that I could do analysis of the tweets received after the event. The archive created can be downloaded as an Excel/CSV file.

This blog post is to show how the Power View option in Excel 2013 can be utilized for performing analysis of Tweets. Once I had the tweets exported to an Excel file, I used the Power View report option to create a new Power View report. See screenshot below.

image

I added a bar chart, a table, a line chart and a pie chart to create a dashboard of sorts in the design area with the following properties:

1. The bar chart shows all the tweets between 28th February, 2103 to 9th March, 2013
2. The line chart shows the tweets from 6th-7th March, 2013 with a 24-hour period
3. The table shows all the users who have tweeted using this hashtag and with a tweet count of over 100.
4. The pie chart shows the percentage of tweets by each user for the period being analyzer with a tweet count over 250.

As it is clear from the above, information present in each of the four components have a different set of filters applied to them.

image
What makes it interesting is that the above report has interactivity built into it. So if I click on any one of the charts or table, the rest of the table/charts also change to reflect the data for the selection made. This is evident from the video at the bottom of this post.

I wanted to take this a bit further, so I created a scatter graph with the Date column as the Play axis. The graph below shows me all twitter handles that have over 150 tweets over a period of three days! This allows me to see how the Twitter accounts were sharing updates/tweets prior to the event and during the event.

image

The video below shows the interactivity features of the Power View report in Excel. What you can do with such rich visualizations are endless. Just by looking at certain visual representations, it is easy to draw interesting conclusions. For example, the timeline shows me that the Bell_Bajao and PixelProject twitter handles were extremely active on the day of the event. There were others who were more silent in the days running upto the event and then started live tweeting/re-tweeting throughout the event. The TOP 5 contributors on the day of the event had a major pie of the tweets that were shared on 7th March. Within a very short time, I was able to decipher trends which would have taken me a while to dig out using traditional analysis methods!

*Note that the above times are based on the US timezone (Pacific time), which is why the 8th March event activity shows up as 7th March on the timeline.

I do know of a lot of individuals who use Twitter raw data for trend analysis. So here is a quick way to get that done with Power View and Excel 2013!