PowerMap – Population of cities in India

In my last post During the September Bangalore UG meeting, I had presented on PowerBI, Power Query, Power Map and Online Search to be specific! In this post, I shall talk specifically about the Power Map feature.

Online Search is an option available in the Power Query tab (screenshot 1) in Excel. Online Search allows you to search public datasets to import data from a large collection of public data sources. Displays the Online Search pane so you can search for public data from Wikipedia. Search results list items that contain the search term anywhere in the title, description, or key words.

image_thumb7

Using online search, I was able to search for a public dataset having the most populated cities in India during 2011. A screenshot of the data is shown below. I am not going to elaborate on how to get the dataset using online search as I had explained that in my earlier post.

image

Now that I had this data, I thought it would be a great idea to represent this in a format which forms an overlay on a map. You will need PowerMap installed before you can use this functionality. Power Map allows you to quickly visualize geospatial data that you have already brought into Excel with Power Query and mashed-up with Power Pivot. Power Map can now be found on the “Insert” tab in Excel for Office 365 ProPlus customers. Subscription customers will have access to all the new and upcoming features of Power Map. See screenshot below.

image

When you launch the Power Map add-in using the “Launch Power Map” drop-down option, you will have the option of creating a new tour or editing an existing tour. The new workspace will provide you options to:

1. Add a new layer and modify it

2. Modify the scene options and animations

3. Define the scale for the visualizations and the type of visualization

4. Define the type of maps being used

The screenshot below shows the work surface. You can see that I have multiple scenes added in my tour.

image

The final video of the PowerMap demo is available below. And all this took me less than 15 minutes! The file is available on OneDrive.

References:

PowerMap
http://blogs.msdn.com/b/powerbi/archive/2014/02/25/power-map-for-excel-now-generally-available-automatically-updated-for-office-365.aspx

PowerBI – Online Query

This is quite a late post for a presentation that was done in September. But as they say, better late than never! During the September Bangalore UG meeting, I had presented on PowerBI, Power Query, Power Map and Online Search to be specific! In this post, I shall talk specifically about Online Search using Power Query.

Online Search is an option available in the Power Query tab (screenshot 1) in Excel. Online Search allows you to search public datasets to import data from a large collection of public data sources. Displays the Online Search pane so you can search for public data from Wikipedia. Search results list items that contain the search term anywhere in the title, description, or key words.

image

imageWhen you click on the Online Search button, you will be present with a search column which allows you to search for data sets online. Before you can do that, you will need to sign in using an account which can utilize PowerBI features. For this blog post, I will be using the Online Search to create a trending chart for Microsoft (MSFT) stock prices.

I used the search string “MSFT Stock” which gave me a list of stock quotes available online. You will be presented with two sets of data:

a. From your organization if you have signed in using your Organizational Account and if someone from your organization has shared dataset pertaining to your search string

b. Publicly available datasets which match your search string

The mouse over on the data set (Screenshot 2) will show you multiple things like a sample view of the data, the columns and the data source details.

If you think that the data set is good to use, you can use the Load drop-down option to load the data into a data model or into an Excel sheet (See Screenshot 3).

image

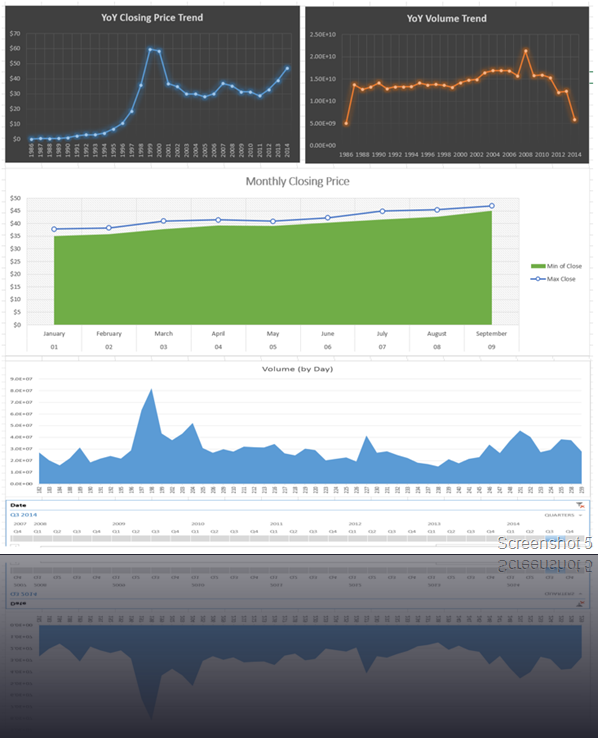
Once you have loaded the data as per your choice, you can cleanse and transform your data using Power Query – Query Editor (see Screenshot 4). Once you have created the necessary transformations, you can create pivot charts and pivot tables using the data. The finished product is shown in Screenshot 5.

I had used a Time dimension from the Azure marketplace to prepare my X-axis that you see in the graphs. How that was done is a topic for another post. Once I had all the relationships built, I was able to build the visualizations shown below. All this took me less than 15 minutes! Smile It is that quick provided you have a decent net connection.

Now here is the awesome part. Going to Data -> Refresh, you can refresh all your data and get the latest view without having to re-design anything again. So this is all ready to be published or shared with anyone you want without worrying if they know how to use Power Query or not!

The Excel file is available on One Drive as well.

As you can see from this post, it is quite easy to create visualizations which provide vital insights using Excel 2013 and Power Query within minutes! Look forward to posts in the future on this topic.


image

image

References:

Power Query Ribbon
http://office.microsoft.com/en-ca/excel-help/guide-to-the-power-query-ribbon-HA103993930.aspx