PowerView and System Health Session– IO Health

Previous posts in this series:

PowerView and System Health Session–CPU health

PowerView and System Health Session–Scheduler Health

PowerView and System Health Session–SQL Memory Health

The SQL Server support team does get a lot of calls regarding slow performance which on analysis leads to a slow performing disk sub-system. The IO_SUBSYSTEM component of the sp_server_diagnostics output in SQL Server 2012 tracks I/O related latch timeouts and long duration I/Os reported along with the filename and the longest pending I/O duration. This information can be very useful when looking at the trends of slow I/O reported on the SQL Server database files on an instance.

As shown earlier in the series, I used this data captured by the sp_server_diagnostics output present in the System Health Session ring buffers to build visualizations using Power Pivot and Power View in Excel 2013. The query available at the bottom of this blog post allowed me to fetch the information from the System Health Session ring buffer into a Power Pivot table.

After that I created a two calculated fields for Hour and Day using the Event Time field in the table. Then, I created two calculated fields for tracking the maximum number of Long IOs and IO Latch Timeouts reported. Then I assigned KPIs to each of these calculated fields. After that I got down to designing the Powershell sheet which finally looked like the image in the screenshot!

The slider enables you to see the KPI status for each day on an hourly basis and the table on the right gives you insights into every snapshot captured by the sp_server_diagnostics output for the hour that you are interested in.

As usual the Excel sheet is available on SkyDrive at: http://sdrv.ms/10O0udO

IO Statistics

Query to fetch the above data is available below:


SET NOCOUNT ON
-- Fetch data for only SQL Server 2012 instances

IF (SUBSTRING(CAST(SERVERPROPERTY ('ProductVersion') AS varchar(50)),1,CHARINDEX('.',CAST(SERVERPROPERTY ('ProductVersion') AS varchar(50)))-1) >= 11)

BEGIN

-- Get UTC time difference for reporting event times local to server time

DECLARE @UTCDateDiff int = DATEDIFF(mi,GETUTCDATE(),GETDATE());

-- Store XML data retrieved in temp table

SELECT TOP 1 CAST(xet.target_data AS XML) AS XMLDATA

INTO #SystemHealthSessionData

FROM sys.dm_xe_session_targets xet

JOIN sys.dm_xe_sessions xe

ON (xe.address = xet.event_session_address)

WHERE xe.name = 'system_health'

AND xet.target_name = 'ring_buffer';

-- Parse XML data and provide required values in the form of a table

;WITH CTE_HealthSession (EventXML) AS

(

SELECT C.query('.') EventXML

FROM #SystemHealthSessionData a

CROSS APPLY a.XMLDATA.nodes('/RingBufferTarget/event') as T(C)

)

SELECT

DATEADD(mi,@UTCDateDiff,EventXML.value('(/event/@timestamp)[1]','datetime')) as [Event Time],

EventXML.value('(/event/data/text)[1]','varchar(255)') as Component,

EventXML.value('(/event/data/value/ioSubsystem/@ioLatchTimeouts)[1]','bigint') as [IO Latch Timeouts],

EventXML.value('(/event/data/value/ioSubsystem/@totalLongIos)[1]','bigint') as [Total Long IOs],

EventXML.value('(/event/data/value/ioSubsystem/longestPendingRequests/pendingRequest/@filePath)[1]','varchar(8000)') as [Longest Pending Request File],

EventXML.value('(/event/data/value/ioSubsystem/longestPendingRequests/pendingRequest/@duration)[1]','bigint') as [Longest Pending IO Duration]

FROM CTE_HealthSession

WHERE EventXML.value('(/event/@name)[1]', 'varchar(255)') = 'sp_server_diagnostics_component_result'

AND EventXML.value('(/event/data/text)[1]','varchar(255)') = 'IO_SUBSYSTEM'

ORDER BY [Event Time];

DROP TABLE #SystemHealthSessionData

END 
Advertisement

PowerView and System Health Session–SQL Memory Health

SQL Server Memory has been always a topic of discussion at most client locations that I visit. So, I thought I will dedicate the third post of my Power View and System Health Session series to Memory usage. SQL Server 2012 instances tracks some very useful information with the help of the sp_server_diagnostics output. I will be concentrating my efforts on the RESOURCE component’s output.

So get ready to have a plethora of information about your SQL Server instance’s memory usage available in a single Power View sheet in Excel 2013!

Continue reading

Tools Tips and Tricks #11: Debug Diag and Memory leaks

This week I had shown how to use Debug Diagnostic tool to capture a dump for a first chance exception encountered by an application and perform analysis using the Crash Analysis rule. Today I am going to show to use Debug Diagnostic tool to track outstanding memory allocations for a process.

Steps

image1. Launch the Debug Diagnostic tool and click on the Rules tab. Click on Add Rule.

2. Select the Native (non-.NET) Memory and Handle Leak rule. (see screenshot on the right)

3. You cannot setup a memory leak tracking rule for a process that is not running as the Leak Tracking dll has to hook onto the imageprocess. In this example, I will be using the tool to track an executable called MemAllocApp.exe. Select the required process using the Select Target window. (see screenshot on the left)

4. In the next window titled “Configure Leak Rule”, you can use that to go granular with your tracking requirements. I have opted not to generate a dump after n minutes of tracking (Option: Generate final userdump after x minutes of tracking). I have selected an auto-unload of the Leak Tracking DLL once the rule is completed or deactivated (Option: Auto-unload Leak Track when rule is completed or deactivated). (see screenshot below)

5. Click on the Configure button and you can then configured additional options for the userdump generation for the process being tracked. I also have the tool set to automatically capture a user dump if the process that I am tracking unexpectedly shuts down. (Configure userdumps for Leak Rule window below in screenshot). I have configured the rule to capture a dump automatically if the process unexpectedly shuts down. (Option: Auto-create a crash rule to get userdump on unexpected process exit). Additionally, I have configured the rule to capture a userdump once the private bytes for the process reaches 350MB. (Option: Generate a userdump when private bytes reach x MB). As you can see in the screenshot below, there are additional options that you can configure but I don’t need them for this particular demo. image

6. Next you get the “Select Dump Location and Rule Name” window where you can changed the rule name and the location of the dumps generation. By default the dumps are generated at <Debug Diagnostic Install Path>\Logs\<Rule Name> folder.

7. Click on Activate Rule in the next window to start the tracking.image

Note: If you are not in the same session as the Debug Diag Service, then you will get the following message when you get the following pop-up, once you have configured the rule. Click on Yes. And then you should get a pop-up stating that Debug Diag is monitoring the EXE for leaks.

Process MemAllocApp.exe(15316) is in the same logon session as DebugDiag (session 2), but it is not in the same logon session as the DbgSvc service (session 0).  Do you want to return to ‘Offline Mode’ and continue?

On the Rules tab, you should see two rules. One for the leak tracking and the other for the crash rule. Once I hit the threshold of 350MB of privates bytes, I will a dump generated and the Userdump Count column value should change to 1. I was monitoring my application’s Private Bytes perfmon counter and the graph showed a steady increase. (see screenshot below). Now that the rule is active, I can find that the Being Debugged column has the value “Yes” and the LeakTrack Status column value will be Tracking for MemAllocApp.exe under the Processes tabs.image I then used the Analyze Data button under the Rules tab to generate the memory tracking report of a memory dump that I had captured earlier which I analyzed and these are a few excerpts from the report. image

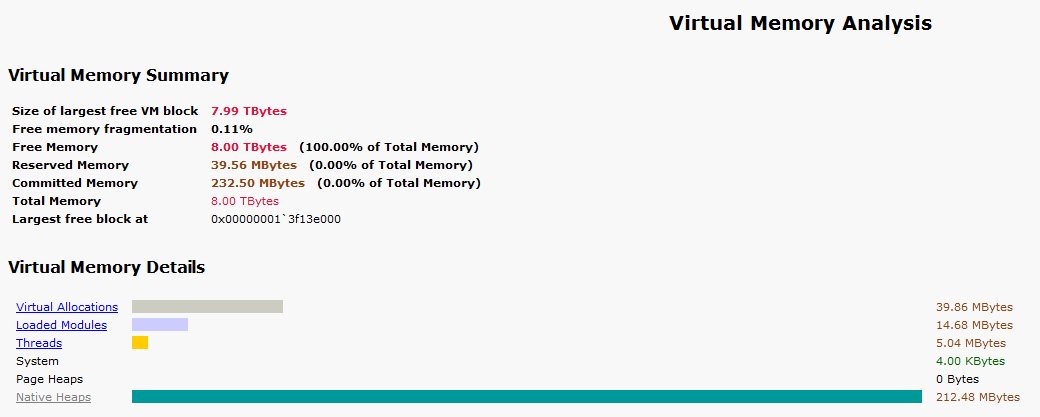
The Analysis Summary tells me that I have outstanding memory allocations of 205MB. This dump was generated using a rule to capture a userdump when Private Bytes for the process exceeded 200MB. Next I shall look at the Virtual Memory Analysis Summary sub-heading…

image

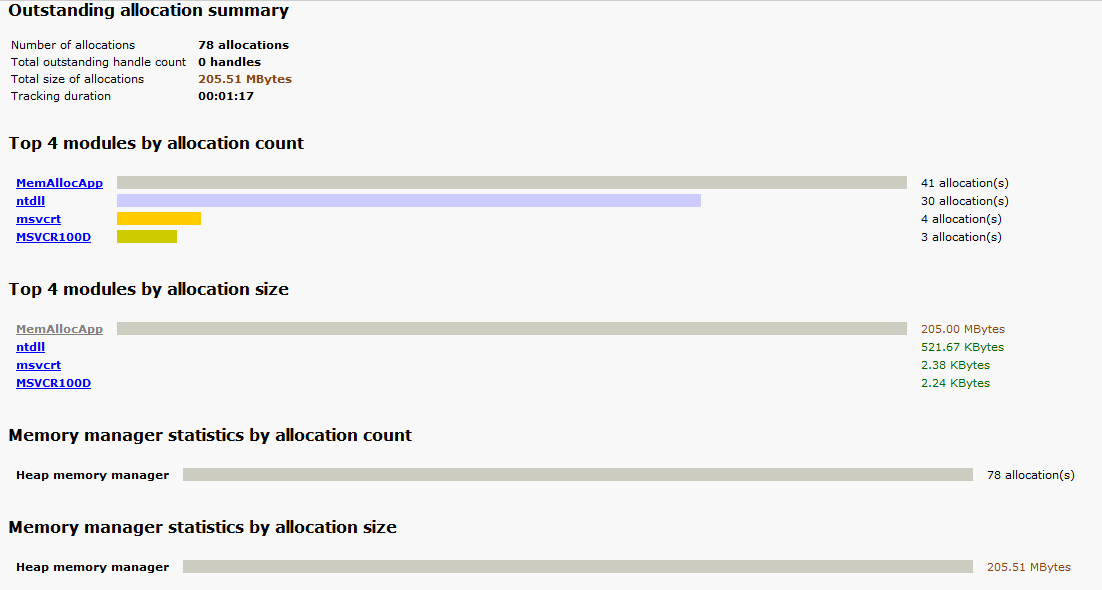
This clearly tells me that the memory allocations are coming from the Native Heaps. And I know from the previous screen-shot that Heap Allocation functions (HeapAlloc) is being called. Now digging into the Outstanding Allocation Summary, I find that over 200MB of allocations have been done from my application and all allocations have been done on the heap. In the Heap Analysis summary, I find that the allocations have all come in from the default process heap. Drilling down into the MemAllocApp hyperlink, I get the offset making these allocations which is MemAllocApp+2cbb. image

The function details from the report is available in the quoted text below. If I have the debug symbols of the application (which I do), I find that this corresponds to my function call fn_allocatememory which makes 5MB allocations using HeapAlloc on the default process heap. If you align your symbols correctly for the analysis, you will find that the report also gives you the correct function names.

Function details

Function
MemAllocApp+2cbb

Allocation type
Heap allocation(s)

Heap handle
0x00000000`00000000

Allocation Count
41 allocation(s)

Allocation Size
205.00 MBytes

Leak Probability
52%

So without any debugging commands, I was able to drill down to the culprit making the maximum number of allocations. This can be quite a useful way of tracking down non-BPool (commonly known as MemToLeave on 32-bit SQL instances) allocations when the Mutli Page Allocations don’t show a high count but you are experiencing non-BPool memory pressure.

The fn_allocationmemory function code is mentioned below:

void fn_allocatememory(int cntr)
{
printf("Sleeping for 10 seconds\n");
Sleep(10000);
BYTE* pByte=(BYTE*) HeapAlloc(GetProcessHeap(), 0, 5242880);
(*pByte)=10;
printf("Iteration %d: Allocating 5MB using HeapAlloc\n",cntr+1);
}

I used the same HeapAlloc function that Sudarshan had used in his latest blog post to explain behavior changes in Windows Server 2008 for tracking heap corruptions.

Common SQL Server myths – Series II – SQL Memory

Not so long ago, I had written a blog post for SQL Server myths related to Setup & Service startup myths for T-SQL Tuesday which was hosted by Sankar Reddy (Blog | Twitter). The round-up of the T-SQL Tuesday posts had some awesome content where renowned SQL Community members debunked common SQL Misconceptions. Read the round-up here.

I found that that this was quite a compelling topic for a series and decided to do a Part II for SQL Myths around memory related misconceptions. SQL Memory by itself is a murky topic and there are quite a few urban legends that are so well imbibed in people’s memories that we have to battle against them to get users to see light at the end of the tunnel. So, here goes another round of debunking some more misconceptions.

Thumbs downAWE needs to be enabled on 64-bit instances for SQL Server
I think everyone who has posted an answer for this question on MSDN forums has probably gone tired of saying the same thing over and over again. This configuration option is required for 32-bit instances of SQL Server only to enable the instance to benefit from the Address Windowing Extension. AWE option on 64-bit instances has no meaning. This is not required and basically does nothing. Please refer the following blog post more details:
http://blogs.msdn.com/b/slavao/archive/2006/03/13/550594.aspx


Thumbs downSystem.OutOfMemoryException encountered while executing a query from SSMS is not a Database Engine Out-of-Memory condition
I have seen multiple suggestions on forums for reducing Max Server Memory. This error is a .NET exception telling the user that an OOM condition occurred. The database engine is not a managed application. It was coded in native language and hence, wouldn’t throw a .NET OOM error. I have written about this in an earlier blog post: System.OutOfMemoryException for Management Studio


Thumbs downWindows Task Manager will tell me SQL Server’s memory usage
Another urban legend that CSS deals with day in and day out. The “Monitoring Memory Usage” topic in SQL Server Books Online talks about how to monitor SQL Server memory usage. None of the tools you typically use to inspect application memory use (Task Manager, Perfmon/Sysmon, etc.) show the amount of AWE memory used by individual processes. There’s no indication of the amount of AWE memory used by each process, nor is this memory included in the working set size reported for a given process. Reference: http://blogs.msdn.com/b/psssql/archive/2009/09/11/fun-with-locked-pages-awe-task-manager-and-the-working-set.aspx


Thumbs downMax Server Memory will limit the SQL Server memory
This is true for only the SQL Server Buffer Pool. Max Server Memory setting is used to control the size of the Buffer Pool only. For a 64-bit instance, the non-BPool region can grow to a maximum of Total Physical Memory – (Max Server Memory + Memory used by Windows & other applications). I had blogged about this in the past in my post: Non Bpool region on 64bit SQL instances may be larger than you think


Thumbs downSQL Server eats up all the available memory on the box
SQL Server is a server application. Ideally, you should have a dedicated server for a SQL instance that has a high number of database transactions. If that is not the case, then the Max Server Memory needs to be capped after taking into account the memory requirements for Windows, SQL Server and the other applications on the box. SQL Server (especially 64-bit) is designed to not back off it’s memory footprint once it grows unless it is asked to because of a low memory notification received from the Operating System. The thumb rule of leaving just 2GB for the OS and other applications may not be enough when you have File Copies, SSRS, SSIS and SQL Database Engine running on the same instance. SQL Server 2005 and above is designed to react to low memory notifications sent out by Windows and scale back it’s memory usage as required.
Reference: http://msdn.microsoft.com/en-us/library/ms178145.aspx


Thumbs downVirtual Address Space – Isn’t that an excuse?
Virtual Address Space defines the amount of memory that can be addressed by any application and the limiting factor is always the processor architecture: 32-bit or 64-bit. 32-bit Windows can reference upto 4GB (232) and 64-bit can reference a maximum of 8TB (264) depending on the Windows edition. The addressing limitations on a 64-bit instance is limited to the availability of your Physical RAM which is an exact opposite of the story of a 32-bit server. With Physical Address Extension enabled on the Windows servers, Windows can use more than 4GB of memory and SQL Server (or any other Windows application if coded correctly) can take advantage of this by using AWE APIs. If you are falling prey to VAS limitations, then you either have a large VAS consumer or your workload is not the most optimal workload for 32-bit architecture! If you are facing a Virtual Address crunch on your SQL instance, then follow the steps mentioned in the post to work towards determining the root cause of the problem: Who is eating up the Virtual Address space on your SQL Server
Reference: http://technet.microsoft.com/en-us/library/ms187499(SQL.90).aspx


Thumbs downI can change –g to whatever I want!
Absolutely not! The hard coded upper limit for –g is 1024GB. Whenever you increase your MemToLeave on a 32-bit machine, you can decreasing the SQL Serve Buffer Pool memory proportionately. Enabling this for a 64-bit instance is bit of a moot-point. So increasing –g is just a workaround and sometimes it might lead you to face BPool pressure on the server. I had documented the layout of the buffer pool for a 32-bit instance in an earlier blog post: SQL Server Memory Basics
Reference: http://msdn.microsoft.com/en-us/library/ms190737(v=SQL.90).aspx


Thumbs downI am Smart! I will enable /3GB and then increase –g. All problems solved!
Well, I would say you are too smart for your own good. For systems with above 16GB of RAM, this can prove to be counter-productive. This will only cause a lack of available System PTEs on the Windows server and create more problems than it actually solves. From “Using AWE” topic in SQL Server Books Online:

If there is more than 16 GB of physical memory available on a computer, the operating system requires 2 GB of virtual address space for system purposes and therefore can support only a 2 GB user mode virtual address space. For the operating system to use the memory range above 16 GB, be sure that the /3gb parameter is not in the Boot.ini file. If it is, the operating system cannot use any physical memory above 16 GB.


Thumbs downLock Pages in Memory is the next best thing after sliced bread!
How many times have we heard this: “Enable LPIM for the SQL service account and everything will be alright”! Everything will be alright only when you have taken into consideration the memory requirements for the SQL Server instance(s) on the box, other applications and Windows and then capped the Max Server Memory. Without that enabling LPIM for the SQL Service account is as good riding a bike on the freeway without a helmet. It’s all smooth sailing till disaster strikes!

 
Hope the above points help clear out some urban legends regarding SQL Server Memory concepts and next time during a coffee break or a water cooler discussion, the above points help you convince a *misguided SQL Server expert*!! Winking smile

[Blog Update]: August posts on SQLServerFAQ

I was working on a root cause analysis for an OOM (Out-of-Memory) issue for SQL Server 2008 R2 and I needed to schedule notifications when the available memory on the server fell below a certain value. SQL Server 2008 and above has a nifty little DMV to do just this. Read about it’s usefulness here:

The hidden gems among DMVs: sys.dm_os_sys_memory