Running SQL Nexus using Command Line Parameters

SQL Nexus is a tool that helps you identify the root cause of SQL Server performance issues. It loads and analyzes performance data collected by SQLDiag and PSSDiag. It can dramatically reduce the amount of time you spend manually analyzing data. One of the least commonly known facts is that the SQL Nexus tool also allows you to run it’s reports using command line arguments or even import diagnostic data automatically. The command line help reference is shown below. You can find more details on GitHub.

sqlnexus.exe [ [ /S [ /E | /Uuser /Ppwd ] [/D"database"] ] | [/C"connstr"] ] [/Iinputpath] [/Ooutputpath] [/Rreport] [/X]

sqlnexus.exe [ [ /S [ /E | /Uuser /Ppwd ] [/D"database"] ] | [/C"connstr"] ] [/Iinputpath] [/Ooutputpath] [/Rreport] [/X] [/Q] [/N]

/S"server"      Specifies a SQL Server name to connect to.
/D"database"    Database to connect to
/E              Log in to SQL using Windows/integrated security
/Uuser          Specifies a SQL (non-Windows) login name
/Ppassword      Specifies the password for a SQL (non-Windows) login
/C"connstring"  Specifies the SqlClient ConnectionString to use (can be used instead of /S /E).
/I"path"        Import SQL diagnostic data from this path
/R"report"      Specifies a report file name to run.
/O"path"        Specifies an export path for reports executed via /R. Also this is where the sqlnexus.000.log would get created
/X              Exit after importing (/I) or exporting (/O) the specified report (/R)
/Vparam=value   Specify the value of a form parameter
/Q              Quiet Mode - minimize windows in console mode
/N              Create a new SQLNexus database before importing (drop existing).

Automating Report Execution

The first scenario that I want to outline is the need to automate a report execution especially when you need to execute the reports repeatedly after activities like performance testing or during some other iterative activity which requires analysis of various sets of diagnostic data.

This can be achieved using the command line parameters shown below:

sqlnexus.exe /S"." /X /D"sqlnexus" /R"\Summary.rdl" /O""

As you can see from the screenshot below, you can see that I have a standard report i.e. “Bottleneck Analysis_C.xls” that was exported and a non-standard report which I created Summary.xls in the same folder. This also gives additional opportunity to create your own performance reports and schedule them using the SQL Nexus executable.

Report Output

After you have the exported reports, you could also write additional automation to email the reports as required.

Automating Data Import

SQL Nexus also allows you to perform data imports automatically using the command line parameters. The command line shown below performs data import from the specified folder into a SQL Server database called sqlnexustest on the default SQL server instance installed on the machine.

sqlnexus.exe /S"." /X /D"sqlnexustest" /I"C:\temp\output"

If the database does not exist on the SQL Server instance, then it will be created. The settings for SQL Nexus utility will be used during the data import which were saved when the last time the UI was used. So if you have disabled the profiler trace import from the UI and saved your settings, then the command line execution will not import the profiler traces.

Advertisement

Chasing the Ghost Cleanup in an Availability Group

Because read operations are mapped to snapshot isolation transaction level, the cleanup of ghost records on the primary replica can be blocked by transactions on one or more secondary replicas. The ghost record cleanup task will automatically clean up the ghost records for disk-based tables on the primary replica when they are no longer needed by any secondary replica. This is similar to what is done when you run transaction(s) on the primary replica. In the extreme case on the secondary database, you will need to kill a long running read-query that is blocking the ghost cleanup. Note, the ghost clean can be blocked if the secondary replica gets disconnected or when data movement is suspended on the secondary database. This state also prevents log truncation, so if this state persists, we recommend that you remove this secondary database from the availability group.

The above is a snippet from the official Microsoft documentation for Availability Group Secondary Replicas under the limitations and restrictions section.

So a transaction on a secondary replica can block an operation on a primary replica… Hmm.. Now that smells like a mystery!

Before I go further, let me explain what Ghost Cleanup does. Let me give you the official text from the Books Online.

Deletes operations from a table or update operations that cause a row to move can immediately free up space on a page by removing references to the row. However, under certain circumstances, the row can physically remain on the data page as a ghost record. Ghost records are periodically removed by a background process. This residual data is not returned by the Database Engine in response to queries.

I had some free time a while back and decided to actually track this down to show how the Ghost Cleanup actually works in an availability group replica. My availability group setup was a simple one which had two SQL Server instances sitting across two different subnets as shown in Screenshot 1.

image

So, let’s get the show on the road and let me walk you through walk you the through the ghost cleanup behavior on the secondary replica.

The DML

On my existing Availability Group setup, I inserted a single row in a table of a primary replica database with the value of 3. The logged operations show up as follows in the SQL Server transaction log.. Psst.. Don’t tell anyone that I was reading the log file Winking smile

image

As you can see from the green highlight above the Transaction ID is 11899 (0x2e7b) which inserted a row on Page ID 315 (ox13b).

What was on the page

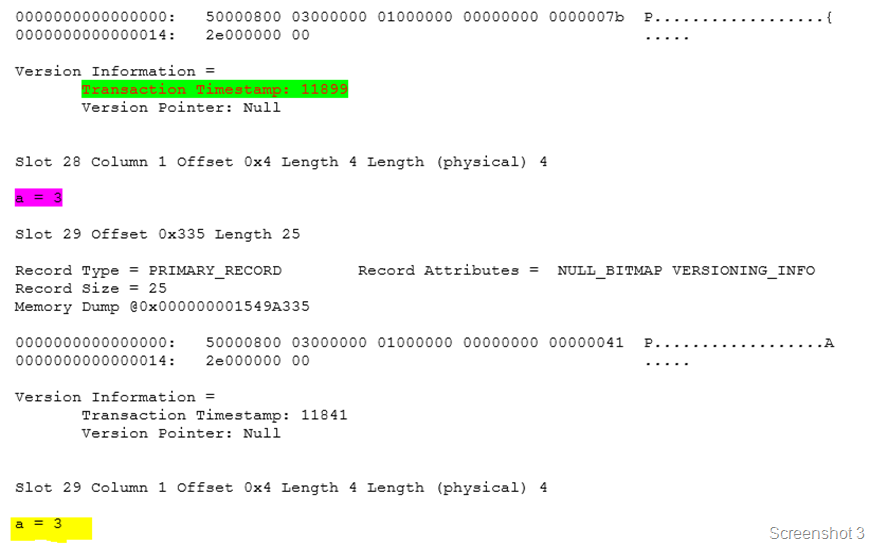
I verified that the page on the primary replica database had the new entry that I had added into the heap using the Page ID retrieved from the transaction log. Note that we are keeping track of the oldest active transaction as well. The record shows the transaction timestamp which was responsible for the DML operation 11899 (0x2e7b). From Screenshot 2 below, you can see that the version information is maintained and the transaction timestamp shows up correctly (green highlight). The value also shows up correctly (pink highlight).
image

What happened after that?

Then I started a transaction on the secondary replica and executed a SELECT query on the same table with a HOLDLOCK hint to keep the row lock. Then I proceeded to delete both the rows with value 3 in the primary replica. I verified that the rows were not retrieved by a SELECT query on the primary and secondary replica. The transaction log dump from secondary replica shows that the changes were replayed.

Oops! I had to read the transaction log again.

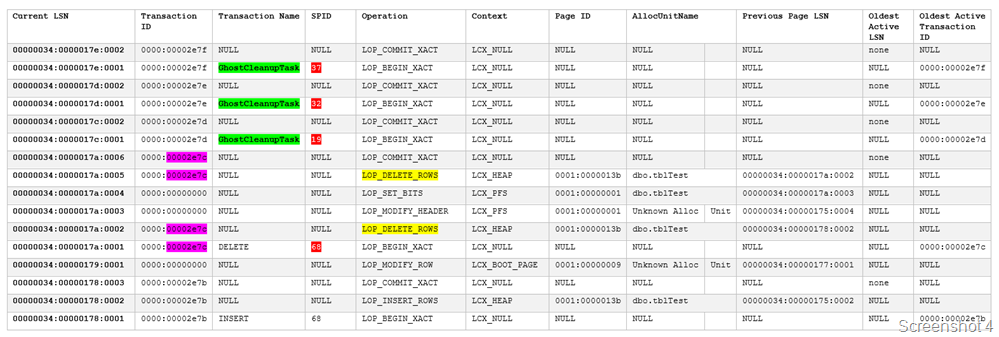
From the green highlights in Screenshot 4, you can see that the GhostCleanupTask transaction ran on the secondary replica. The pink highlights shows that the transaction ID 11900 (0x2e7c) deleted two rows from the Page ID 315 (ox13b). So all is good now.
image

Curiosity killed the cat!

imageWell curiosity got the better of me and I decided to check if the same the story was being told inside the transaction log of the primary replica database. And this is where David Duchovny’s a.k.a. Agent Moulder and Gillian Anderson a.k.a. Agent Scully’s faces from the X-Files will be an apt representation of what I present next.

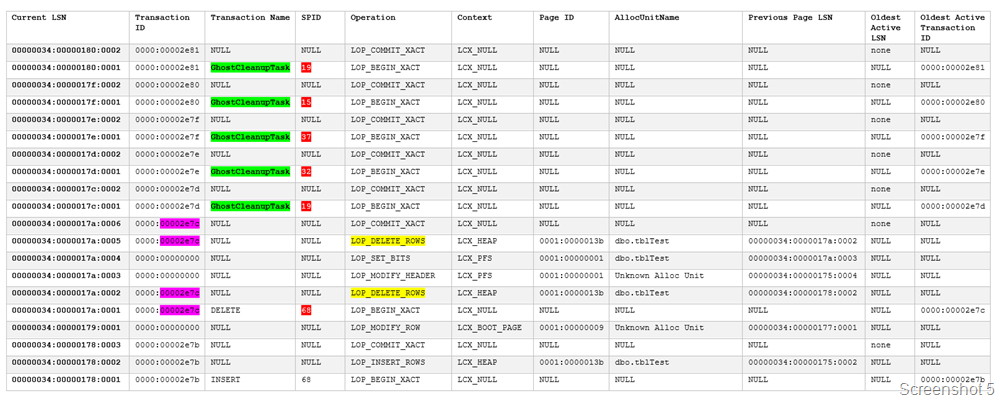
Screenshot 5 will show that the Ghost Cleanup Task continues to execute on the Primary Replica Database! What now executed? Did we not delete the rows and verify everything was alright…

The first observation is that the transaction log is being replayed to the letter on the secondary replica. Notice that the transaction IDs of the Ghost Cleanup Task correspond with the transaction IDs of the Ghost Cleanup Task found on the secondary replica instance database. It wasn’t a joke when the documentation said that transactions are replayed on the secondary replica!

The yellow highlights show that the rows were deleted from the table that I had performed the delete on. The pink highlights confirm that the same transaction was associated with both the deletes.

I had verified that there were no ghost records in the database when I started the repro. So, the important question was:

Why Ghost Cleanup Task was running repeatedly on the primary replica database?
image

What was really happening: THE EXPLANATION

Since I had an open transaction on the secondary replica database, I had an active version store! Screenshot 6 shows that my active version store on the secondary replica with a transaction sequence number of 11900 (0x2e7c) which matches the transaction ID of the delete operation. This active version stored was created on the delete operation because I had performed a SELECT with a HOLDLOCK earlier as mentioned in this post on the table from the secondary replica.

Then I created a table on the primary replica database and inserted a row in it. I checked if this data was available on the secondary replica and it was!

image

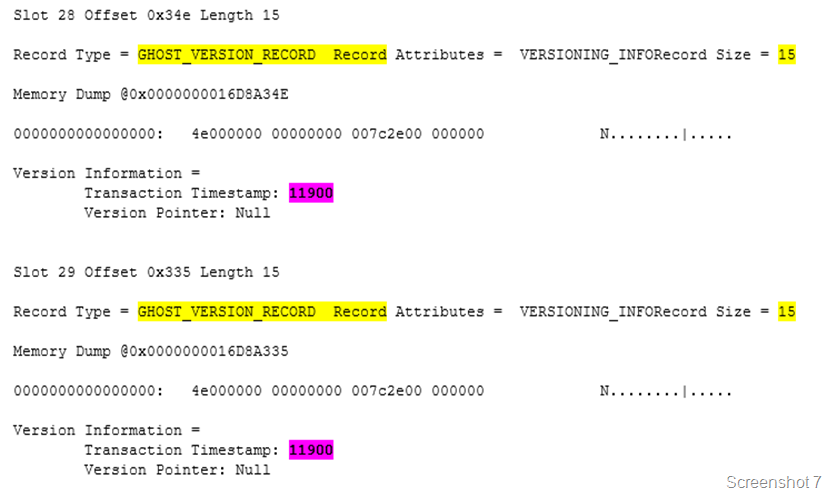
I found that on the primary replica, the database page shows ghost version records (Screenshot 7). The transaction timestamp matches the transaction ID which performed the delete operation i.e. transaction ID 11900 (0x2e7c).
image

Light at the end of the tunnel

Once transaction which I had stated on the secondary replica with the HOLDLOCK hint was committed, the ghost cleanup task was able to perform the cleanup on the primary replica’s page. Once this was completed successfully, the ghost records on the secondary replica were cleaned up promptly as well.

The above behavior is true for both synchronous and asynchronous modes of operation.

I hope this was a fun Friday read! Have a good weekend!

Cache files–Why are you increasing in size?

Management Data Warehouse provides a mechanism to collect Perfmon and DMV outputs and store them in a SQL Server database to help you troubleshoot performance issues that you might have faced in the past. This is quite helpful for intermittent performance issues that you might face on you SQL Server instances as it might not be possible to have someone monitoring the system 24X7 to troubleshoot the performance problem when it is occurring.

Management Data Warehouse provides two ways of collecting data:

1. Cached mode – This stores the Collection Set data in a .cache file in the cache file directory which is uploaded to the MDW database based on the schedule that you defined for your Collection Set.
2. Non-cached mode – This method of collection data using a Collection Set doesn’t depend on local cache. It collects the data pertaining to the Collection Set and uploads the data based on two different configuration options: On Demand or based on a schedule.

MDW_CollectionWorkFlow

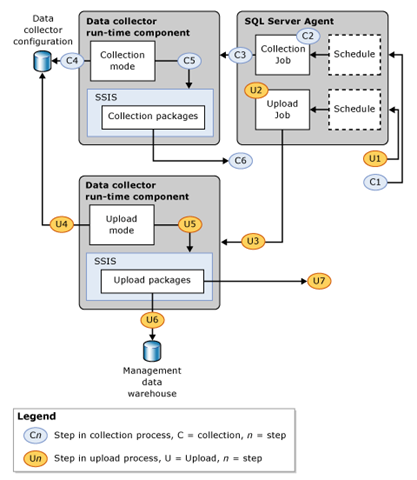
The screen shot (left) from Books Online of the run-time processing of the MDW jobs shows how the data is uploaded to the MDW database. When you have a highly transactional system with large number of concurrent connections to your SQL Server instance or a lot of processes running on the Windows Server, the amount of data collected by the System Data Collection Sets can be quite large for a single iteration especially for the Server Activity system data collection set.

So what can happen if the .cache files become very large. Let’s say your collection frequency is set to every 15 minutes. This means that the Data Collection set will collect data every 15 minutes. The scheduled upload will then use this cache file to upload the data using the SSIS upload package(s).

Now what happens if you miss an upload schedule because the upload job ran longer than 15 minutes. This means that your .cache file now has 2 sets of data to be uploaded. This cumulative addition of successive collection sets over a period of time with missed upload schedules can cause a problem once the upload job takes more than 60 minutes. The SSIS package(s) are hard-coded to timeout after 60 minutes of execution. Then you are stuck with cache data in your cache folder which cannot be uploaded.

When the SSIS package times out after 60 minutes of execution, you will get the following error in the job history for the job associated with the upload package:

Server Activity,Error,4861,Server Activity,,Error,The thread “ExecMasterPackage” has timed out 3600 seconds after being signaled to stop.,Upload,17/05/2011 13:11:37,,17/05/2011 14:11:38,3601,<server name>,,,

So what are your options here.

Option 1
1. Change the Server Activity collection to non-cached – This change would ensure that the data is uploaded as soon as it is collected without using an interim cache file.
2. Increase the collection frequency – The collection frequency is set to default of 15 seconds. This can be increased to 30 seconds or higher to prevent very large data being collected between the scheduled upload intervals.
3. Modify the sp_purge_data stored procedure for the purge job to run faster – An updated version of sp_purge_data is available here. This will ensure that the purge job completes faster.

Option 2
Evaluate the perfmon counters being collected in the Server Activity collection set. Find out which perfmon counters are required and then create a custom collection set to capture this data with a non-cached mode for data collection.

You can create your custom perfmon collection set as the default Server Activity collection set has a large number of perfmon counters from which data is collected and uploaded.

Below is a custom collection set created for Performance Monitor counters. I have shown how to collect Server specific perfmon counters and SQL instance specific perfmon counters.

use msdb;

Begin Transaction

Begin Try

Declare @collection_set_id_1 int

Declare @collection_set_uid_2 uniqueidentifier

EXEC [dbo].[sp_syscollector_create_collection_set]

@name=N'Perfmon Counter Collection Set',

@collection_mode=1,

@description=N'Collects Perfmon Counters ',

@target=N'',

@logging_level=0,

@days_until_expiration=7,

@proxy_name=N'',

@schedule_name=N'CollectorSchedule_Every_5min',

@collection_set_id=@collection_set_id_1 OUTPUT,

@collection_set_uid=@collection_set_uid_2 OUTPUT

Select @collection_set_id_1, @collection_set_uid_2


Declare @collector_type_uid_3 uniqueidentifier

Select @collector_type_uid_3 = collector_type_uid From [dbo].[syscollector_collector_types] Where name = N'Performance Counters Collector Type';

Declare @collection_item_id_4 int


EXEC [dbo].[sp_syscollector_create_collection_item]

@name=N'Logical Disk Collection and SQL Server CPU',

@parameters=N'<ns:PerformanceCountersCollector xmlns:ns="DataCollectorType">

<PerformanceCounters Objects="LogicalDisk" Counters="Avg. Disk Bytes/Read" Instances="*" />

<PerformanceCounters Objects="LogicalDisk" Counters="Avg. Disk Bytes/Write" Instances="*" />

<PerformanceCounters Objects="LogicalDisk" Counters="Avg. Disk sec/Read" Instances="*" />

<PerformanceCounters Objects="LogicalDisk" Counters="Avg. Disk sec/Write" Instances="*" />

<PerformanceCounters Objects="LogicalDisk" Counters="Disk Read Bytes/sec" Instances="*" />

<PerformanceCounters Objects="LogicalDisk" Counters="Disk Write Bytes/sec" Instances="*" />

<PerformanceCounters Objects="Process" Counters="% Privileged Time" Instances="*" />

<PerformanceCounters Objects="Process" Counters="% Processor Time" Instances="*" />

<PerformanceCounters Objects="Process" Counters="% User Time" Instances="*" />

<PerformanceCounters Objects="$(INSTANCE):Buffer Manager" Counters="Page life expectancy" Instances="*" />

</ns:PerformanceCountersCollector>',

@collection_item_id=@collection_item_id_4 OUTPUT,

@frequency=5,

@collection_set_id=@collection_set_id_1,

@collector_type_uid=@collector_type_uid_3

select @collection_item_id_4

Commit Transaction;

End Try


Begin Catch

Rollback Transaction;

DECLARE @ErrorMessage NVARCHAR(4000);

DECLARE @ErrorSeverity INT;

DECLARE @ErrorState INT;

DECLARE @ErrorNumber INT;

DECLARE @ErrorLine INT;

DECLARE @ErrorProcedure NVARCHAR(200);

SELECT @ErrorLine = ERROR_LINE(),

@ErrorSeverity = ERROR_SEVERITY(),

@ErrorState = ERROR_STATE(),

@ErrorNumber = ERROR_NUMBER(),

@ErrorMessage = ERROR_MESSAGE(),

@ErrorProcedure = ISNULL(ERROR_PROCEDURE(), '-');


RAISERROR (14684, @ErrorSeverity, 1 , @ErrorNumber, @ErrorSeverity, @ErrorState, @ErrorProcedure, @ErrorLine, @ErrorMessage);


End Catch;

Reference:
How to: Create a Custom Collection Set That Uses the Generic T-SQL Query Collector Type
Using SQL Server 2008 Management Data Warehouse for database monitoring in my application

DBREINDEX and ALTER INDEX differences

I had written about update statistics a long time back and had been meaning to write a clarification on the difference in behavior w.r.t. table statistics being updated when rebuilding indexes using different T-SQL commands. I am sure all of you are aware of why statistics for a table need to be updated with a fullscan to ensure that the optimizer doesn’t fall prey to sub-optimal plans. However, there is a little known fact about how statistics get affected when a DBREINDEX is issued on a table versus an ALTER INDEX…REBUILD ALL.

I created a table with 4 integer columns and inserted 100,000 records into the table using the script below:

-- Create table
create table tblUpdStats (a int primary key,b int,c int, d int)
-- Insert 100,000 rows in the table
set nocount on
declare @var int = 1
while @var<=100000
begin
insert into tblUpdStats values(@var,@var+1,@var+2,@var+3)
set @var+=1
end
-- Create a non-clustered index on column b
create index idx_b on tblUpdStats(b)
-- Create a user-defined statistics on column c
create statistics stat_c on tblUpdStats(c)
-- Execute the following to query so that the database engine creates an auto-created stats on column d
select d from tblUpdStats where d > 50000
Name                            Updated              Rows    Rows Sampled
------------------------------- -------------------- ------- ------------
idx_b                           May 13 2011  8:03PM  100000  100000
PK__tblUpdSt__3BD0198E558AAF1E  May 13 2011  8:03PM  100000  100000
stat_c                          May 13 2011  8:03PM  100000  100000
_WA_Sys_00000004_53A266AC       May 13 2011  8:03PM  100000  100000

I took a snapshot of the DBCC SHOW_STATISTICS output for the statistics associated with the non-clustered index, clustered index, user created statistics and auto-created statistics. All the rows and rows sampled are equal which means that the statistics are updated with a fullscan. I then inserted another 100,000 rows into the same table. I then executed the following command to rebuild the indexes on the table:

alter index all on tblstats rebuild

I took a snapshot of the DBCC SHOW_STATISTICS command again and notice the difference below:

Name                            Updated              Rows     Rows Sampled
--------------------------------------------------------------------------
idx_b                           May 13 2011  8:19PM  200000   200000
PK__tblUpdSt__3BD0198E558AAF1E  May 13 2011  8:19PM  200000   200000
stat_c                          May 13 2011  8:03PM  100000   100000
_WA_Sys_00000004_53A266AC       May 13 2011  8:03PM  100000   100000

You will see that the user created and auto-created statistics do not reflect the change in the number of rows. However when I execute a DBREINDEX on the table, I see a different picture altogether. (See show_statistics output below)

dbcc dbreindex ('tblUpdStats','')
Name                               Updated              Rows      Rows Sampled
 ---------------------------------- -------------------- --------- --------------
 idx_b                              May 13 2011  8:31PM  200000    200000
 PK__tblUpdSt__3BD0198E558AAF1E     May 13 2011  8:31PM  200000    200000
 stat_c                             May 13 2011  8:31PM  200000    200000
_WA_Sys_00000004_53A266AC           May 13 2011  8:31PM  200000    200000

Now if I look at the rows sampled and rows column values, I see that the updated column shows the same date for all the objects. In this case the rows sampled and rows are the same indicating that a fullscan occurred for the user created/auto created statistics on the table.

To summarize, ALTER INDEX…REBUILD ALL will not update statistics which were manually created or were auto-created by the Database Engine. It will only update statistics associated with the indexes defined on the table columns. On the other hand, a DBCC DBREINDEX on the table will update statistics for the user created statistics and the auto-created statistics using the default sampling rate. The default sampling comes into play for very large tables. If you have a maintenance plan job which does an index rebuild operation on SQL Server 2005 or above, then that uses an ALTER INDEX…REBUILD command.

T-SQL Tuesday #016 : Aggregate Functions

This month’s T-SQL Tuesday is being hosted by Jes Borland (Twitter | Blog) and the topic for this month is “Aggregate Functions”. What really caught my eye was the play on the T-SQL functions to accentuate the fact why Jes justifies her twitter handle of grrrl_geek:
 

Let’s SUM(thoughts), COUNT(ways we’ve done things), and set MAX(awesome) on our posts!

So at this point, I shall SELECT Content FROM PastExperience WHERE Type = ‘Aggregate Functions’ and pen it together in this blog post!

Aggregate functions have been a great way to slice-and-dice data stored in any RDBMS product and present it in the form which the business wants or would want to look at it. I have seen and also written multiple T-SQL queries in the past which use the HAVING clause along with aggregation functions to filter out data from the final dataset. I was very excited about the use of GROUPING option using ROLLUP for the set of canned queries that I had for aggregating analysis for SQL Performance cases while using SQL Nexus/RML Utilities.

The query below gives me an aggregation of the SUM of all the CPU/Duration/Reads/Writes which completed execution during the time the profiler traces were captured.


select a.hashid,b.OrigText,
SUM(a.duration) as SumDuration, SUM(a.Reads) as SumReads, Sum(a.Writes) as SumWrites,SUM(a.CPU) as SumCPU,
MAX(a.duration) as MAXDuration, MAX(a.Reads) as MAXReads, MAX(a.Writes) as MAXWrites,MAX(a.CPU) as MAXCPU,
MIN(a.duration) as MINDuration, MIN(a.Reads) as MINReads, MIN(a.Writes) as SumWrites,MIN(a.CPU) as MINCPU,
AVG(a.duration) as AVGDuration, SUM(a.Reads) as AVGReads, Sum(a.Writes) as AVGWrites,SUM(a.CPU) as AVGCPU,
GROUPING(a.hashid) AS [GroupNo]
from readtrace.tblBatches a
inner join readtrace.tblUniqueBatches b
on a.HashID = b.HashID
where EndTime is not null
group by  a.hashid,b.OrigText WITH ROLLUP

With the use of the above query, I get the all the queries with their average, minimum, maximum and total statistics of all the queries along with a rollup of the reads, writes, duration and CPU.

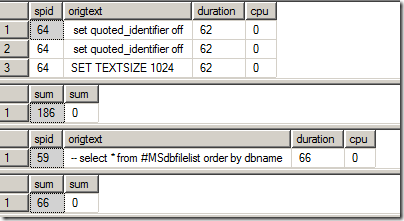
COMPUTE is another new introduction into the world of T-SQL which can really help with data analysis especially from my perspective, since I spend a significant part of my day looking into SQL Performance issues. The query below will give me all the long running batches along with the duration/CPU information for each run with a computed sub-total for each such aggregated row.

select a.spid,b.origtext,a.duration, a.cpu
from readtrace.tblBatches a
inner join readtrace.tblUniqueBatches b
on a.HashID = b.HashID
where EndTime is not null
order by a.duration,a.spid
compute sum(duration) , sum(cpu)  BY a.duration,a.spid;

An example output is:

image

Another example where Aggregation helps is identifying the amount of CPU usage by queries which were captured using profiler traces. Why is this important, you ask? This is very important when I need to compare the CPU usage time reported by SQL Server (captured using Perfmon/WMI etc.) and the actual time the user queries spent executing on CPU. The Statement, RPC, Batch and SP completed events capture the CPU consumption for each request. Aggregating them together gives you the ability to figure out the amount of time that was spent by user queries while executing on CPU. The approach used below uses UNIONS and SUM to figure out the total percentage of CPU used by the queries which completed during the profiler trace capture. The only parameter value that you need to provide is the number of CPUs i.e. the number of logical CPUs being used by the SQL instance. The reason I highlighted the phrase in the previous line is because that the below T-SQL batch works on the presumption that the profiler traces which were captured had all the completed events and captured completion events for all queries that were executing during the timeframe of the data collection. This batch would provide incorrect results if you have a long running CPU driven query which continues executing even after the profiler trace capture is stopped. This batch is ideal for scenarios where a profiler trace was started, a workload executed on the server and then the profiler trace was stopped. Under such a scenario, this would help you in identifying the percentage CPU usage for all queries executed by the workload.

DECLARE @MinTime DATETIME
DECLARE @MaxTime DATETIME
DECLARE @ms_diff BIGINT
DECLARE @number_of_cpus INTEGER

SET @number_of_cpus = 2  --Change this as necessary

SELECT
@MinTime = MIN(ISNULL(u.MinTime, '12-31-9999'))
FROM
(
SELECT MIN(StartTime) AS MinTime
FROM ReadTrace.tblBatches
UNION ALL
SELECT MIN(EndTime) AS MinTime
FROM ReadTrace.tblBatches
UNION ALL
SELECT MIN(StartTime) AS MinTime
FROM ReadTrace.tblStatements
UNION ALL
SELECT MIN(EndTime) AS MinTime
FROM ReadTrace.tblStatements
) AS u

SELECT
@MaxTime = MAX(ISNULL(u.MaxTime, '01-01-1900'))
FROM
(
SELECT MAX(StartTime) AS MaxTime
FROM ReadTrace.tblBatches
UNION ALL
SELECT MAX(EndTime) AS MaxTime
FROM ReadTrace.tblBatches
UNION ALL
SELECT MAX(StartTime) AS MaxTime
FROM ReadTrace.tblStatements
UNION ALL
SELECT MAX(EndTime) AS MaxTime
FROM ReadTrace.tblStatements
) AS u

IF (@MinTime = '12-31-9999' OR @MaxTime = '01-01-1900')
BEGIN
RAISERROR ('ERROR: The trace does not contain appropriate columns to determine the min/max time values for events in the trace.',
16, 1)
RETURN
END

SELECT
@ms_diff = DATEDIFF(ms, @MinTime, @MaxTime) * @number_of_cpus
FROM
ReadTrace.tblBatches AS b

SELECT @MinTime AS MinTime, @MaxTime AS MaxTime, @ms_diff AS total_CPU_milliseconds, @number_of_cpus AS NumCpus

SELECT
(CAST(SUM(cpu) AS FLOAT) / @ms_diff) * 100 AS cpu_percentage,
SUM(cpu) AS sum_cpu, COUNT(*) AS executions, ub.normtext
INTO
#temp_cpu_percentages
FROM
ReadTrace.tblBatches AS b
INNER JOIN ReadTrace.tblUniqueBatches AS ub
ON b.HashID = ub.HashId
GROUP BY
ub.normtext
HAVING
SUM(cpu) > 0
ORDER BY
sum_cpu DESC

&nbsp;

SELECT SUM(t.cpu_percentage) AS SQL_cpu_usage_percent
FROM #temp_cpu_percentages AS t

SELECT TOP 10 *
FROM #temp_cpu_percentages AS t
ORDER BY t.cpu_percentage DESC

DROP TABLE #temp_cpu_percentages

What was the objective of this post?

1. Point out two not-so-commonly used T-SQL functionality (GROUPING/COMPUTE/ROLLUP) which can be quite helpful.

2. Show a few ways of aggregating, slicing and dicing data imported into a SQL Nexus database for quick analysis.

Books Online references:

GROUP BY (Transact-SQL)

COMPUTE (Transact-SQL)