Tools Tips and Tricks: Round-up

Last month I ran a blog series on the different Tools that CSS uses for certain troubleshooting scenarios SQL Server related issues. There were 12 posts that covered the use of different tools like Debug Diagnostic, XPerf, tools from Sysinternals, SQLDIAG, SQL Nexus and some debugging tips.

Now it is time to do a SELECT [PostURL], [Summary] FROM [TroubleshootingSQL].[tblBlogSeries] WHERE [Series] = ‘Tools Tips and Tricks’…..

Post#1: Tools Tips and Tricks #1: Process MonitorSome best practices to be followed when capturing Process Monitor traces to ensure that the data collection doesn’t causes additional performance issues.

Post#2: Tools Tips and Tricks #2: SQL Express RANU instances Explains how to connect to SQL Express Run As User Instances (RANU) using existing tools.

Post#3: Tools Tips and Tricks #3: Custom Rowsets using SQL NexusAnother quick tip on using SQL Nexus to import outputs of .sql scripts used to capture diagnostic data using Rowset Importer.

Post#4: Tools Tips and Tricks #4: RML Utilities – Some helpful tips on the use of RML Utilities which is used by SQL Nexus under the hood for importing SQL Profiler traces into a SQL Server database.

Post#5: Tools Tips and Tricks #5: SQLDIAG and RANU – Explains how to capture diagnostic data for SQL Express Run As User Instances (RANU) using SQLDIAG.

Post#6: Tools Tips and Tricks #6: Custom Reports in SQL NexusA quick tip on how to create custom reports for SQL Nexus a tool widely used within CSS for analyzing performance diagnostic data collected from a SQL Server instance.

Post#7: Tools Tips and Tricks #7: PsExec as parent and ProcMon as childExplains how to use PsExec (a tool from Sysinternals) to launch a process remotely and capture data. In this example, I have used Process Monitor as the remote process.

Post#8: Tools Tips and Tricks #8 – Debug Diagnostic and Crash Rules – A walkthrough on using Debug Diagnostic tool for capturing crash dumps and analyzing them using the Crash Analysis rule.

Post#9: Tools Tips and Tricks #9: PSSDIAG Configuration Manager – Explains how to configure PSSDIAG collection using Configuration Manager GUI with a few tips and tricks on tweaking the XML configuration file.

Post#10: Tools Tips and Tricks #10: Caching PDB files locally – Explains how to cache symbol files locally using CDB.exe.

Post#11: Tools Tips and Tricks #11: Debug Diag and Memory leaks – A walkthrough on configuring Debug Diag for tracking memory leaks for a program which can be extended to tracking non-BPool allocations for SQL Server.

Post#12: Tools Tips and Tricks #12: XPerf, Memory usage and much more – A walkthrough on how to use XPerf Heap allocation tracking for identifying memory consumers for a program. Can be extended to SQL Server Out-of-Memory (OOM) issues for non-BPool memory crunch.

Tools Tips and Tricks #12: XPerf, Memory usage and much more

This is the last post for the series Tools Tips and Tricks as May draws to a close. Today I shall talk about another tool that we use called XPerf for performance troubleshooting. Though this is not a common tool which is used on a regular basis by the SQL CSS team. But when we do decide to use this for very specific scenarios, the usefulness of this tool cannot be put in words. I had talked about using Debug Diag for monitoring memory usage and tracking down allocations right upto the function call. There is another way to track heap allocations which is what I shall be talking about today. I shall use the same MemAllocApp that I had used last week. I start off the Xperf monitoring using the following commands:

xperf -on PROC_THREAD+LOADER -BufferSize 1024 -MinBuffers 16 -MaxBuffers 16
xperf -start HeapSession -heap -Pids 9532 -BufferSize 1024 -MinBuffers 128 -MaxBuffers 128 -stackwalk HeapAlloc+HeapRealloc+HeapCreate

Now once I have collected the XPerf data, you can use the following command to stop the data collection:

xperf -stop HeapSession -stop –d F:\MemAlloc.etl

Once that is done, you should have an ETL file in the specified location by the –d parameter. Since, I am interested in the functions in the functions which were allocating the maximum amount of memory, I will use the following command to generate a summary report for the heap allocations traced by XPerf using the command below:

xperf -i "F:\MemAlloc.etl" -o "F:\MemAlloc.txt" -symbols -a heap -stacks -top 5

/* Output of MemAlloc.txt file */

Results for process MemAllocApp.exe (9532):

———————————————————————

GLOBAL ALLOCATIONS:
Alloc       :         100,     512000.0 KB
Realloc     :           0
Outstanding :         100,     512000.0 KB

———————————————————————

TOP 1:
Alloc       :         100,     512000.0 KB
Realloc     :           0
Outstanding :         100,     512000.0 KB

———————————————————————

MemAllocApp.exe!fn_allocatememory
MemAllocApp.exe!wmain
MemAllocApp.exe!__tmainCRTStartup
MemAllocApp.exe!wmainCRTStartup
kernel32.dll!BaseThreadInitThunk
ntdll.dll!RtlUserThreadStart

Alloc       :         100,     512000.0 KB
Realloc     :           0
Outstanding :         100,     512000.0 KB


As you can see from the above output, the function fn_allocatememory was responsible for 100 allocations worth 512KB each. With just the use of a single command I was able to figure out the reason behind my outstanding allocations for my EXE. Troubleshooting SQL Server outstanding memory allocations for heaps may not be as easy as this but it definitely saves time in having to look and dig out the allocations from the a memory dump.

This method is quite useful when you have a very large ETL file which you need to analyze. You can even configure a Circular Buffer for capturing data appending the following command for your HeapSession tracing commands:

-BufferSize 1024 -MaxBuffers 1024 -MaxFile 1024 -FileMode Circular

Note: Make sure that you set your _NT_SYMBOL_PATH environment variable correctly if you want the function calls to be resolved correctly.

Hope you enjoyed this series of Tools Tips and Tricks as much as I had fun in posting the various methods that I use to collect diagnostic data while troubleshooting SQL performance related issues.

References:
Using Actions to process Heap Data
Enabling Data Capture using XPerf
XPerf Options

Tools Tips and Tricks #11: Debug Diag and Memory leaks

This week I had shown how to use Debug Diagnostic tool to capture a dump for a first chance exception encountered by an application and perform analysis using the Crash Analysis rule. Today I am going to show to use Debug Diagnostic tool to track outstanding memory allocations for a process.

Steps

image1. Launch the Debug Diagnostic tool and click on the Rules tab. Click on Add Rule.

2. Select the Native (non-.NET) Memory and Handle Leak rule. (see screenshot on the right)

3. You cannot setup a memory leak tracking rule for a process that is not running as the Leak Tracking dll has to hook onto the imageprocess. In this example, I will be using the tool to track an executable called MemAllocApp.exe. Select the required process using the Select Target window. (see screenshot on the left)

4. In the next window titled “Configure Leak Rule”, you can use that to go granular with your tracking requirements. I have opted not to generate a dump after n minutes of tracking (Option: Generate final userdump after x minutes of tracking). I have selected an auto-unload of the Leak Tracking DLL once the rule is completed or deactivated (Option: Auto-unload Leak Track when rule is completed or deactivated). (see screenshot below)

5. Click on the Configure button and you can then configured additional options for the userdump generation for the process being tracked. I also have the tool set to automatically capture a user dump if the process that I am tracking unexpectedly shuts down. (Configure userdumps for Leak Rule window below in screenshot). I have configured the rule to capture a dump automatically if the process unexpectedly shuts down. (Option: Auto-create a crash rule to get userdump on unexpected process exit). Additionally, I have configured the rule to capture a userdump once the private bytes for the process reaches 350MB. (Option: Generate a userdump when private bytes reach x MB). As you can see in the screenshot below, there are additional options that you can configure but I don’t need them for this particular demo. image

6. Next you get the “Select Dump Location and Rule Name” window where you can changed the rule name and the location of the dumps generation. By default the dumps are generated at <Debug Diagnostic Install Path>\Logs\<Rule Name> folder.

7. Click on Activate Rule in the next window to start the tracking.image

Note: If you are not in the same session as the Debug Diag Service, then you will get the following message when you get the following pop-up, once you have configured the rule. Click on Yes. And then you should get a pop-up stating that Debug Diag is monitoring the EXE for leaks.

Process MemAllocApp.exe(15316) is in the same logon session as DebugDiag (session 2), but it is not in the same logon session as the DbgSvc service (session 0).  Do you want to return to ‘Offline Mode’ and continue?

On the Rules tab, you should see two rules. One for the leak tracking and the other for the crash rule. Once I hit the threshold of 350MB of privates bytes, I will a dump generated and the Userdump Count column value should change to 1. I was monitoring my application’s Private Bytes perfmon counter and the graph showed a steady increase. (see screenshot below). Now that the rule is active, I can find that the Being Debugged column has the value “Yes” and the LeakTrack Status column value will be Tracking for MemAllocApp.exe under the Processes tabs.image I then used the Analyze Data button under the Rules tab to generate the memory tracking report of a memory dump that I had captured earlier which I analyzed and these are a few excerpts from the report. image

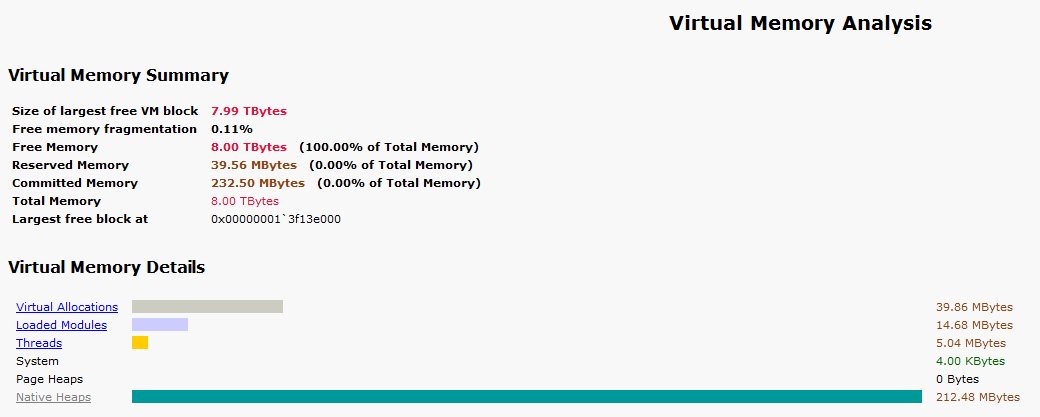
The Analysis Summary tells me that I have outstanding memory allocations of 205MB. This dump was generated using a rule to capture a userdump when Private Bytes for the process exceeded 200MB. Next I shall look at the Virtual Memory Analysis Summary sub-heading…
image

This clearly tells me that the memory allocations are coming from the Native Heaps. And I know from the previous screen-shot that Heap Allocation functions (HeapAlloc) is being called. Now digging into the Outstanding Allocation Summary, I find that over 200MB of allocations have been done from my application and all allocations have been done on the heap. In the Heap Analysis summary, I find that the allocations have all come in from the default process heap. Drilling down into the MemAllocApp hyperlink, I get the offset making these allocations which is MemAllocApp+2cbb. image
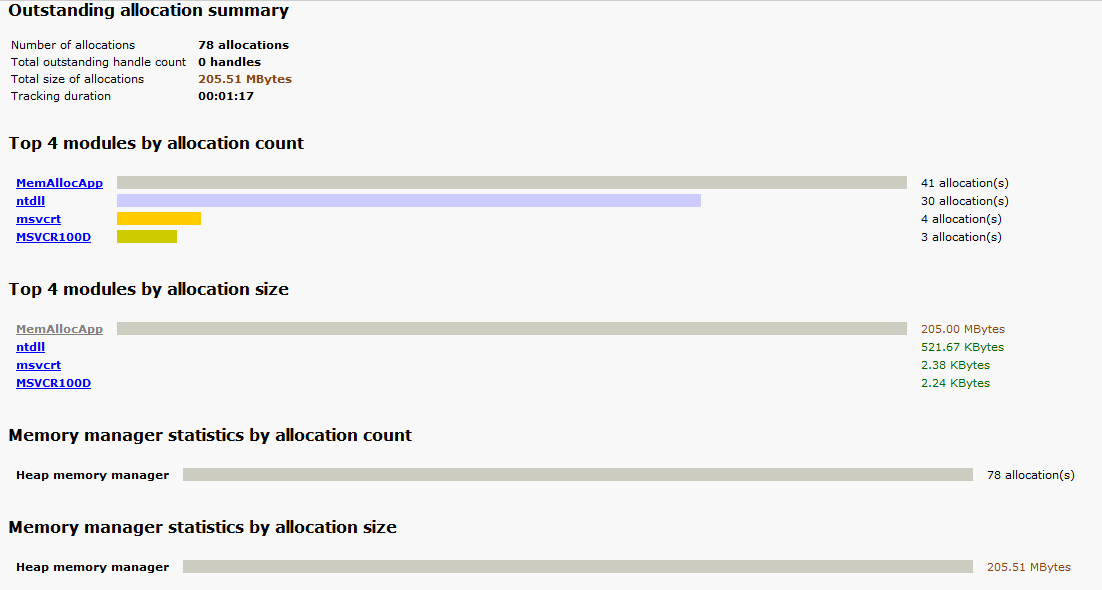
The function details from the report is available in the quoted text below. If I have the debug symbols of the application (which I do), I find that this corresponds to my function call fn_allocatememory which makes 5MB allocations using HeapAlloc on the default process heap. If you align your symbols correctly for the analysis, you will find that the report also gives you the correct function names.

Function details

Function
MemAllocApp+2cbb

Allocation type
Heap allocation(s)

Heap handle
0x00000000`00000000

Allocation Count
41 allocation(s)

Allocation Size
205.00 MBytes

Leak Probability
52%

So without any debugging commands, I was able to drill down to the culprit making the maximum number of allocations. This can be quite a useful way of tracking down non-BPool (commonly known as MemToLeave on 32-bit SQL instances) allocations when the Mutli Page Allocations don’t show a high count but you are experiencing non-BPool memory pressure.

The fn_allocationmemory function code is mentioned below:

void fn_allocatememory(int cntr)
{
printf("Sleeping for 10 seconds\n");
Sleep(10000);
BYTE* pByte=(BYTE*) HeapAlloc(GetProcessHeap(), 0, 5242880);
(*pByte)=10;
printf("Iteration %d: Allocating 5MB using HeapAlloc\n",cntr+1);
}

I used the same HeapAlloc function that Sudarshan had used in his latest blog post to explain behavior changes in Windows Server 2008 for tracking heap corruptions.

Tools Tips and Tricks #10: Caching PDB files locally

When you are debugging a SQL Server memory dump, you would need the PDB files associated with the sqlservr.exe that you are debugging to get the call stacks. The PDB files can be downloaded from the Microsoft Symbol Server. Paul Randal [Blog | Twitter] in a previous blog post showed how to do this using symchk.exe. If you want to download symbols for multiple EXEs then you either need to create a script file or you could use the method mentioned below provided you have a dump file that you are interested in.

Today I am going to explain how to download PDB files using CDB (Command Line Debugger) and command script file. The first ingredient for this is a memory dump file (.mdmp or .dmp). Once you have the dump and the Windows Debugging Tools installed on your local machine, you use the following command to cache the symbols to a local folder:

C:\Program Files\Debugging Tools for Windows (x64)>cdb -y srv*D:\PublicSymbols*http://msdl.microsoft.com/download/symbols -z “D:\SQLDump0134.mdmp” -cfr “D:\ExecuteSymbolFetch.txt” > D:\DebuggingExample.txt

The –y parameter specifies the local folder into which the symbols need to be cached and the –z parameter is the path to the memory dump file. The –cfr parameter takes the path to the script file which contains the script file to be executed. The contents of my script file are:

!sym noisy
.reload /f
lmvm sqlservr
qd

When you look into the DebuggingExample.txt file once the download has completed, you will find the output of the lmvm command which will show you that the PDB file was cached locally:

0:031> lmvm sqlservr
sqlservr   (pdb symbols)          d:\publicsymbols\sqlservr.pdb\389EF554D94A4947846D85FCDC4233382\sqlservr.pdb

Alternatively, you could load the dump using WinDBG and then using the commands from the script file mentioned above to cache the symbols. You would need to set the symbol file path using File->Symbol File Path or CTRL+S option or using the debugger command .sympath. Once that is done, you can executed .reload /f to download the PDB files from the Microsoft Symbol Server. This is helpful when you need symbol files while capturing certain debugging diagnostic data like generating the XML file with the callstacks from a Process Monitor trace as shown here or if you want to perform an analysis using the existing scripts provided with the Debug Diagnostic tool.

Debugging Download location:
64-bit Debugging Tools
32-bit Debugging Tools

References:
Using Script files for Windows Debugger
Command line CDB options

Tools, Debugging, Tools Tips and Tricks

Tools Tips and Tricks #9: PSSDIAG Configuration Manager

I had been waiting for Diag Manager to be made public so that this post could go online. Diag Manager is a configuration tool that is used by CSS Engineers to configure a consolidated data collection for Windows Perfmon counters and SQL Server profiler trace (server-side). Additionally, the tool lets you add pre-configured custom diagnostics for Analysis Services configuration data, Mirroring configuration, Event log collection etc. and even custom data collection (using .sql scripts/custom utilities) which can be added using the Custom Diagnostics-> _MyCollectors option. (UI Screenshot below)

image

The tip that I want to talk about with this tool is that .CAB file generated uses a PSSDIAG.XML configuration file when using SQLDIAG to collect data. If you need to collect data from multiple different instances using the same configuration file, then you can just use the same extracted .CAB file contents with small tweaks to the SQLDIAG.XML file.

Changing the machine name from which the data needs to be collected: Change the machine name to the appropriate machine name.

<Machine name="MyLaptop">

Changing the instance name from which the data needs to be collected: Change the instance name value to the appropriate SQL Server instance name. MSSQLSERVER as instance name for default instance.

<Instance name="INST1" windowsauth="true" ssver="10" user="">

Disabling/Enabling perfmon data collection: Change the enabled option to true to enable perfmon data collection or false to disable collection. The maxfilesize parameter controls the perfmon file rollover size.

<PerfmonCollector enabled="true" pollinginterval="5" maxfilesize="256">

Changing the profiler trace collection and the rollover file size: Change the enabled value to true/false to enable/disable profiler data collection. Changing the maxfilesize parameter value controls the rollover file size for the profiler traces.

<ProfilerCollector enabled="true" template="_GeneralPerformance90.xml" pollinginterval="5" maxfilesize="350">

Collecting SQLDIAG output during startup/shutdown: This can be controlled using the enabled parameter value and the startup parameter value determines if the SQLDIAG output is to be collected during PSSDIAG startup/initialization. The shutdown parameter controls whether a SQLDIAG output needs to be captured once PSSDIAG collection is signaled to be stopped using CTRL+C.

<SqldiagCollector enabled="true" startup="false" shutdown="true" />

The other option that you have now that you have a GUI is to using Diag Manager to configure a new package for your target machine and click on Save. You will notice in the Save Configuration window, you have two locations that can be modified, one for the PSSDIAG.XML file and one for the .CAB file. Generate a new PSSDIAG.XML file and replace the existing file from a previously configured PSSDIAG with the newly generated PSSDIAG.XML for your new settings to take effect when the PSSDIAG launched again.

Another option that engineers use regularly for a long term PSSDIAG collection is the “Delete Old Trace Files” custom diagnostics. This is an option that is used for long term data collection. More information about this custom diagnostic is available in the FAQs section on Codeplex.

Note: The XML configuration for SQL Server 2008 and 2008 R2 can be mixed and matched using the ssver=”10.5” for SQL Server 2008 R2 instances and ssver=”10” for SQL Server 2008 instances. However, you shouldn’t use the same configured package across different platforms (x86/x64/ia64) and nor should you use the same package for different releases of SQL Server (2005/2008/2008 R2).

We have also documented some Common Issues faced while collecting data using a configured package. In case you have a question regarding the tool, feel free to post a new discussion. In case you find a defect that you need to report, you can log the defect under the Issue Tracker section.

Blog post talking about the release: http://blogs.msdn.com/b/psssql/archive/2011/05/24/pssdiag-sqldiag-configuration-manager-released-to-codeplex.aspx

This is a widely used tool in Microsoft Services for consolidated data collection while working on SQL Server performance issues. In case you have any feedback, please feel free to provide the same on the discussion forum for the tool on Codeplex.