Lessons learnt while using the Cloud Adapter

During the last week of August, I had blogged about how to get your on-premise database to your SQL Server instance running on an Azure virtual machine. I had run into a few issues while trying to run the wizard provided by Management Studio.

The First Stumble

This error is easy to circumvent and pretty much mentioned in the online documentation. The error message would read as:

Failed to locate a SQL Server of version 12.0.2000 or later installed on the remote machine. Please verify that a SQL Server of the same or higher version than the source SQL Server is installed on the remote machine.

The above error is self-explanatory. There is a requirement that the source database engine version be lower or equal to the version of the SQL Server instance running on Azure. Eg. You cannot deploy a database from a SQL Server 2014 instance to a SQL Server 2012 instance running on an Azure VM.

The Second Stumble

The second common error that you might run into is:

The Cloud Adapter port configuration is not valid. Verify the virtual machine endpoint configurations.

The above error will be encountered when the endpoint is not configured for the Azure virtual to accept connections from the outer realm! This can be easily rectified by adding a TCP endpoint to your Azure virtual machine for 11435 which is the port that the SQL Server Cloud Adapter Service is listening on. This is also mentioned in the online documentation. Once you have created the endpoint for your Azure virtual for your on-premise server to connect with the Cloud Adapter service, your endpoint configuration should look like the one in the screenshot below:

image

The Third Stumble

The next issue could be with permissions/authentication or it might not be as easy as it seems.

Cloud Adapter operation failed due to invalid authentication. Verify the virtual machine name, user name, and password.

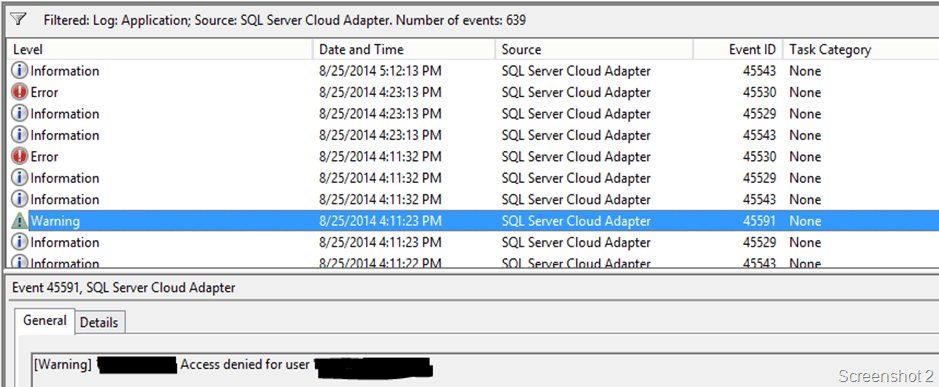
So the first thing to check if you have the correct account name and password. If it is due to an authentication error, then the application event log of the Azure Virtual Machine will show the following error with the source as SQL Server Cloud Adapter service as shown in Screenshot 2. The text of the error message is mentioned below.

Access denied for user <user name>

image

The other error that you might encounter is when the SQL Server Cloud Adapter service tries to enumerate the database engines installed on the virtual machine. The error would still be talking about the authentication which is reported by the management studio wizard but a little investigation into the application event logs of the virtual machine will show the following error:

[Error] <ip address> Exception in GetSqlInstances(): SQL Server WMI provider is not available on <machine name>.. Stack trace:    at Microsoft.SqlServer.Management.Smo.Wmi.ManagedComputer.TryConnect()
   at Microsoft.SqlServer.Management.Smo.Wmi.WmiSmoObject.get_Proxy()
at Microsoft.SqlServer.Management.Smo.Wmi.WmiSmoObject.EnumChildren(String childTypeName, WmiCollectionBase coll)
at Microsoft.SqlServer.Management.Smo.Wmi.ServerInstanceCollection.InitializeChildCollection()
at Microsoft.SqlServer.Management.CloudAdapter.Tasks.GetSqlInstances()
at Microsoft.SqlServer.Management.CloudAdapter.CloudAdapter.GetSqlInstances(String username, String password). Inner Exception: Invalid namespace .

The above error clearly states that the GetSqlInstances() method failed. Microsoft.SqlServer.Management.Smo.Wmi namespace contains classes that provide programmatic access to the Windows Management Instrumentation (WMI) from an SMO application. I had talked about needing the shared management objects in an earlier post. The SQL Server 2014 WMI provider is also required which is available by installing the client connectivity components from any SQL Server 2014 setup including SQL Server Express. The components that I had installed were:

a. Client Tools Connectivity

b. Client Tools Backwards Compatibility

If you are not sure if you have the WMI provider, then look for the file “C:\Program Files (x86)\Microsoft SQL Server\120\Shared\sqlmgmproviderxpsp2up.mof“. This is the SQL Server 2014 MOF file. Another way to test if the WMI provider is working without running the wizard every time and have it fail is to run the PowerShell commands below on your Azure Virtual Machine. This script will tell you where the instance enumeration being performed by the deployment wizard will work or fail.

[System.reflection.assembly]::LoadWithPartialName("Microsoft.SqlServer.Smo")
[System.Reflection.Assembly]::LoadWithPartialName("Microsoft.SqlServer.SqlWmiManagement")
$m = New-Object ('Microsoft.SqlServer.Management.Smo.Wmi.ManagedComputer') '.'
foreach ($svi in $m.ServerInstances)
{
	$svi.Name;
}

This post was intended to document that common issues that you might run into while deploying a database from an on-premise SQL Server instance to a SQL Server instance running on an Azure Virtual Machine.

Advertisement

Chasing the Ghost Cleanup in an Availability Group

Because read operations are mapped to snapshot isolation transaction level, the cleanup of ghost records on the primary replica can be blocked by transactions on one or more secondary replicas. The ghost record cleanup task will automatically clean up the ghost records for disk-based tables on the primary replica when they are no longer needed by any secondary replica. This is similar to what is done when you run transaction(s) on the primary replica. In the extreme case on the secondary database, you will need to kill a long running read-query that is blocking the ghost cleanup. Note, the ghost clean can be blocked if the secondary replica gets disconnected or when data movement is suspended on the secondary database. This state also prevents log truncation, so if this state persists, we recommend that you remove this secondary database from the availability group.

The above is a snippet from the official Microsoft documentation for Availability Group Secondary Replicas under the limitations and restrictions section.

So a transaction on a secondary replica can block an operation on a primary replica… Hmm.. Now that smells like a mystery!

Before I go further, let me explain what Ghost Cleanup does. Let me give you the official text from the Books Online.

Deletes operations from a table or update operations that cause a row to move can immediately free up space on a page by removing references to the row. However, under certain circumstances, the row can physically remain on the data page as a ghost record. Ghost records are periodically removed by a background process. This residual data is not returned by the Database Engine in response to queries.

I had some free time a while back and decided to actually track this down to show how the Ghost Cleanup actually works in an availability group replica. My availability group setup was a simple one which had two SQL Server instances sitting across two different subnets as shown in Screenshot 1.

image

So, let’s get the show on the road and let me walk you through walk you the through the ghost cleanup behavior on the secondary replica.

The DML

On my existing Availability Group setup, I inserted a single row in a table of a primary replica database with the value of 3. The logged operations show up as follows in the SQL Server transaction log.. Psst.. Don’t tell anyone that I was reading the log file Winking smile

image

As you can see from the green highlight above the Transaction ID is 11899 (0x2e7b) which inserted a row on Page ID 315 (ox13b).

What was on the page

I verified that the page on the primary replica database had the new entry that I had added into the heap using the Page ID retrieved from the transaction log. Note that we are keeping track of the oldest active transaction as well. The record shows the transaction timestamp which was responsible for the DML operation 11899 (0x2e7b). From Screenshot 2 below, you can see that the version information is maintained and the transaction timestamp shows up correctly (green highlight). The value also shows up correctly (pink highlight).

image

What happened after that?

Then I started a transaction on the secondary replica and executed a SELECT query on the same table with a HOLDLOCK hint to keep the row lock. Then I proceeded to delete both the rows with value 3 in the primary replica. I verified that the rows were not retrieved by a SELECT query on the primary and secondary replica. The transaction log dump from secondary replica shows that the changes were replayed.

Oops! I had to read the transaction log again.

From the green highlights in Screenshot 4, you can see that the GhostCleanupTask transaction ran on the secondary replica. The pink highlights shows that the transaction ID 11900 (0x2e7c) deleted two rows from the Page ID 315 (ox13b). So all is good now.

image

Curiosity killed the cat!

imageWell curiosity got the better of me and I decided to check if the same the story was being told inside the transaction log of the primary replica database. And this is where David Duchovny’s a.k.a. Agent Moulder and Gillian Anderson a.k.a. Agent Scully’s faces from the X-Files will be an apt representation of what I present next.

Screenshot 5 will show that the Ghost Cleanup Task continues to execute on the Primary Replica Database! What now executed? Did we not delete the rows and verify everything was alright…

The first observation is that the transaction log is being replayed to the letter on the secondary replica. Notice that the transaction IDs of the Ghost Cleanup Task correspond with the transaction IDs of the Ghost Cleanup Task found on the secondary replica instance database. It wasn’t a joke when the documentation said that transactions are replayed on the secondary replica!

The yellow highlights show that the rows were deleted from the table that I had performed the delete on. The pink highlights confirm that the same transaction was associated with both the deletes.

I had verified that there were no ghost records in the database when I started the repro. So, the important question was:

Why Ghost Cleanup Task was running repeatedly on the primary replica database?

image

What was really happening: THE EXPLANATION

Since I had an open transaction on the secondary replica database, I had an active version store! Screenshot 6 shows that my active version store on the secondary replica with a transaction sequence number of 11900 (0x2e7c) which matches the transaction ID of the delete operation. This active version stored was created on the delete operation because I had performed a SELECT with a HOLDLOCK earlier as mentioned in this post on the table from the secondary replica.

Then I created a table on the primary replica database and inserted a row in it. I checked if this data was available on the secondary replica and it was!

image

I found that on the primary replica, the database page shows ghost version records (Screenshot 7). The transaction timestamp matches the transaction ID which performed the delete operation i.e. transaction ID 11900 (0x2e7c).

image

Light at the end of the tunnel

Once transaction which I had stated on the secondary replica with the HOLDLOCK hint was committed, the ghost cleanup task was able to perform the cleanup on the primary replica’s page. Once this was completed successfully, the ghost records on the secondary replica were cleaned up promptly as well.

The above behavior is true for both synchronous and asynchronous modes of operation.

I hope this was a fun Friday read! Have a good weekend!

Handling Deadlocked Schedulers is a piece of cake now

I had written walkthroughs (Part 1 | Part 2) on how to troubleshoot a Deadlocked Schedulers condition for SQL Server instances. Deadlocked Schedulers is a condition where all your SQL Server worker threads are exhausted and no new work requests are being picked up by the SQL Server instance.

Starting from SQL Server 2012, the System Health extended events session tracks deadlocked schedulers condition using the extended event (scheduler_monitor_deadlock_ring_buffer_recorded). The session tracks other useful events which makes it easy to trace back the series of events which led to the deadlocked schedulers condition!

I will be using the Extended Events UI in SQL Server 2012 management studio to show how the target file of the System Health session can be used to track deadlocked schedulers condition experienced by your SQL Server instance.

Continue reading

Fluffy in an Availability Group Failover Scenario

Over the past month or so, I have been dealing with a lot of questions around the troubleshooting failover scenarios for Availability Groups. So I decided that it is now time for me to pen down a post on the data to be collected and analysis options for digging into the root cause for an Availability Group. I did have time on my hands and decided to induce a Hollywood element into this post as well. The availability group name that I would be using in this post is named as Fluffy. Fluffy has two secondary Availability Replicas: one synchronous and the other one an asynchronous replica.

As you can see in the screenshot below, I had initiated a failover for my Availability Group and the AlwaysOn
Extended Events sessions shows a state change. The Extended Events session writes to a target file (.xel) which is present in the SQL Server LOG folder.

The Extended Event session runs by default when an Availability Group is configured on the SQL Server instance. The following extended events are captured by the Event Session:

  • sqlserver.alwayson_ddl_executed,
  • sqlserver.availability_group_lease_expired,
  • sqlserver.availability_replica_automatic_failover_validation,
  • sqlserver.availability_replica_manager_state_change,
  • sqlserver.availability_replica_state_change,
  • sqlserver.error_reported

Note that the Extended Events session will only track the state changes for the local replica. The Extended Events session is NOT a global store for all the state change events for all replicas!

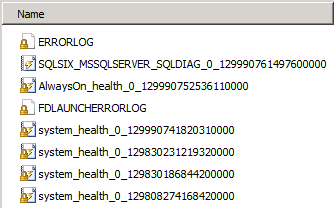
The previous set of logs that you collect from the SQL Server failover cluster instances like the SQL Errorlog, Cluster log and Windows Event logs are still applicable for root cause analysis for failovers. However, now you have additional logs in the SQL Server LOG folder which can assist with a root cause analysis for failover issues. The screenshot below shows two new files that would be of interest when analyzing SQL Server failovers namely, the AlwaysOn_health_* and <server name>_<instance name>_SQLDIAG_* logs. The first set of files are the AlwaysOn Extended Events logs and the second set of logs are called the Failover Cluster Instance Diagnostics Log.

We already saw from the above screenshot what the AlwaysOn Extended Events health session can track. Now, let’s see what the Failover Cluster Instance Diagnostics Log collects. There will be multiple informational messages about the activities performed against the Availability Group. Additionally, there will be messages pertaining to the sp_server_diagnostics data (component_health_resultset) collection and the Availability Group state change (availability_group_state_change).

The T-SQL query below can help you fetch the state change information for your SQL Server instance. Again, this is specific to the instance from which you fetched the failover cluster instance diagnostics log:

select object_name,cast(event_data as xml) as xmldata
from sys.fn_xe_file_target_read_file('<file name/path>', null, null, null)
where object_name = 'availability_group_state_change'

A snippet of the XML data retrieved using the above query for the manual failover that I had done is shown below:

<data name=”target_state“>
<
value>2</value>
<text>Online</text>
</data>
<data name=”failure condition level“>
<value>3</value>
<text >SYSTEM_UNHEALTHY</text>
</data>


<data name=”availability_group_name”>
<value>FLUFFY</value>
</data>

</event>


In summary, the following sets of logs need to be collected from all the Availability Replicas:

  1. SQL Server Errorlog from the time of the failure
  2. Windows Application and System Event logs from the time of the failure
  3. All the Failover Cluster Instance Diagnostics log (upto a maximum of 10 rollover .xel files by default)
  4. All the AlwaysOn Extended Event session log files (upto a maximum of 4 rollover .xel files by default)
  5. System Health Session Extended Event session files (optional as the component health state information is present in #4)
  6. Windows Cluster log

There are some useful queries in the Books Online topic for the failover cluster instance diagnostics log to parsing through the collected data.

Happy troubleshooting!!

P.S. The above blog post was created using a lab environment provided by SQL Server Virtual Labs. This is an online environment which allows you to create virtual machines to practice various SQL Server scenarios. The lab that I used was “SQL Server 2012: AlwaysOn Availability Groups (SQL 142).

Awesomesauce: Finding out missing sequences

Another of those #sqlhelp inspired posts. This was around ways to track down missing numbers in a sequence table. This task can be done in multiple ways and as I like to say that there are multiple ways to skin a cat! However, this blog post is about using the new T-SQL enhancements in SQL Server 2012 to figure out missing sequential numbers. I will demonstrate this using an example.

I have a table tblsequences which has two integer columns with the primary key being an int datatype. I did some random inserts into the table. The script below can be used to find out missing sequential numbers in an identity column or an integer column which is supposed to store sequential values.


-- Replace starting value with minimum starting value and increment for your sequence
-- Replace the table name with the table name that you are interested in
declare @startvalue int = 1, @increment int = 1
;with cte as
(
select a,(a-lag(a,1) OVER (ORDER BY a)) as MissingSequences
from tblsequences
)
select a, (MissingSequences/@increment)-1 as MissingSequences
from cte
where MissingSequences > @increment
union all
select TOP 1 MIN (a),
CASE (MIN(a)- @startvalue)/@increment
when 0 then null
else (MIN(a)- @startvalue)/@increment
end as MissingSequences
from tblsequences
group by a
order by a

The output is as shown below in the screenshot. You will notice that the first column reports the primary key value and the MissingSequences column reports the number of missing sequential values lesser than the value in the first column. You will need to make the necessary changes to the two scripts shown in this blog post so that the tables you want analyzed are done so.

image

Next, lets talk about Sequences which is a new feature in SQL Server 2012. I created a new sequence using the a start value of 10 and an increment value of 3.

I used the Sequence which was created for generating OrderID values in two different tables. Now we are posed with an interesting problem. I have two different tables in which I want to compare missing sequence numbers. This can be done with T-SQL code below.


-- Replace schema name, table name(s) and sequence name as appropriate
declare @startvalue int = 1,@interval int = 1, @seqname sysname = 'TestSeq', @schemaname sysname = 'dbo'
select @startvalue = TRY_CAST(TRY_CAST(start_value as varchar(255)) as int),
@interval = TRY_CAST(TRY_CAST(increment as varchar(255)) as int)
from sys.sequences
where name = @seqname and [schema_id] = (select [schema_id] from sys.schemas where name = @schemaname)

if (@startvalue IS NOT NULL and @interval IS NOT NULL)
begin
;with cte as
(
select OrderID,(OrderID-lag(OrderID,1) over (order by OrderID)) as MissingSequences
from
(select OrderId as OrderID
from tblTestSeq
union all
select OrderId as OrderID
from tblTestSeq_2) A
)
select OrderID, (MissingSequences/@interval)-1 as MissingSequences
from cte
where MissingSequences > @interval
union all
select TOP 1 OrderID,
CASE (MIN(OrderID)- @startvalue)/@interval
when 0 then null
else (MIN(OrderID)- @startvalue)/@interval
end as MissingSequences
from tblTestSeq
group by OrderID
order by OrderID
end
else

else
begin
PRINT 'CAST FAILED'
end


The logic used is the same as the logic when we were looking for missing sequences in identity/integer columns described in the first half of the post. However, since sequences can be used for one or more tables, I have used a UNION query to get all the columns together which use the same sequence object. The second result set of the output in the screenshot below shows the tables involved along with the sequential OrderIDs. As you can see below, there are 4sequence numbers missing  10, 13, 16 and 28. The first result set reports exactly that by notifying that there are 3 sequence ids missing lesser than 19 and 1 sequence number missing lesser than 31.

The output of the above T-SQL script is shown in the screenshot below.

image

Another way how T-SQL enhancements in SQL Server 2012 can make your life easier.

Happy T-SQL coding and a have a great weekend!