PowerBI – Online Query

This is quite a late post for a presentation that was done in September. But as they say, better late than never! During the September Bangalore UG meeting, I had presented on PowerBI, Power Query, Power Map and Online Search to be specific! In this post, I shall talk specifically about Online Search using Power Query.

Online Search is an option available in the Power Query tab (screenshot 1) in Excel. Online Search allows you to search public datasets to import data from a large collection of public data sources. Displays the Online Search pane so you can search for public data from Wikipedia. Search results list items that contain the search term anywhere in the title, description, or key words.

image

imageWhen you click on the Online Search button, you will be present with a search column which allows you to search for data sets online. Before you can do that, you will need to sign in using an account which can utilize PowerBI features. For this blog post, I will be using the Online Search to create a trending chart for Microsoft (MSFT) stock prices.

I used the search string “MSFT Stock” which gave me a list of stock quotes available online. You will be presented with two sets of data:

a. From your organization if you have signed in using your Organizational Account and if someone from your organization has shared dataset pertaining to your search string

b. Publicly available datasets which match your search string

The mouse over on the data set (Screenshot 2) will show you multiple things like a sample view of the data, the columns and the data source details.

If you think that the data set is good to use, you can use the Load drop-down option to load the data into a data model or into an Excel sheet (See Screenshot 3).

image

Once you have loaded the data as per your choice, you can cleanse and transform your data using Power Query – Query Editor (see Screenshot 4). Once you have created the necessary transformations, you can create pivot charts and pivot tables using the data. The finished product is shown in Screenshot 5.

I had used a Time dimension from the Azure marketplace to prepare my X-axis that you see in the graphs. How that was done is a topic for another post. Once I had all the relationships built, I was able to build the visualizations shown below. All this took me less than 15 minutes! Smile It is that quick provided you have a decent net connection.

Now here is the awesome part. Going to Data -> Refresh, you can refresh all your data and get the latest view without having to re-design anything again. So this is all ready to be published or shared with anyone you want without worrying if they know how to use Power Query or not!

The Excel file is available on One Drive as well.

As you can see from this post, it is quite easy to create visualizations which provide vital insights using Excel 2013 and Power Query within minutes! Look forward to posts in the future on this topic.


image

image

References:

Power Query Ribbon
http://office.microsoft.com/en-ca/excel-help/guide-to-the-power-query-ribbon-HA103993930.aspx

Advertisement

WOOT: Schema Changes History Report on Power View

The last post in this series talked about using Power View to analyze the data stored in the SQL Server’s default trace. I decided to take this a step further by creating the Schema Changes History report with the help of the data that I retrieved from the Default Traces. The advantage of a report created in Power View is that the interactivity which is missing in the standard report is available.

The way I created this report was to filter the data in the Power Pivot table using EventClass ID 46, 47 and 164 for only looking at the create, drop and alter commands which the default trace tracks. After that I created a table with a tile on the Database Name and a 100% Stacked Bar Chart to show the activity at a database level.

I also had to create linked tables for getting the Object Type and the Event Class Name that you see in the table below.

I will provide a final version of the Excel sheet once I have completed the other dashboards and sanitized the information available in the Power Pivot table.

SchemaChangesHistory

Previous Post in the Series:

Default Trace Dashboard
https://troubleshootingsql.com/2013/09/26/woot-default-trace-and-power-view/

WOOT: Default Trace and Power View

I have been working on building visualizations for various kinds of analysis that I perform for my customers. One such useful visualization was the use of Power View for analyzing the data available in the SQL Server Default Trace. The query below lets you retrieve all the information in the default traces. This same query is used to populate the Power Pivot table in the Excel file.


declare @enable int

-- Check to find out if Default Server Side traces are running
select top 1 @enable = convert(int,value_in_use) from sys.configurations where name = 'default trace enabled'

if @enable = 1 --default trace is enabled
begin

declare @d1 datetime;
declare @diff int;
declare @curr_tracefilename varchar(500);
declare @base_tracefilename varchar(500);
declare @indx int ;

select @curr_tracefilename = path from sys.traces where is_default = 1 ;

set @curr_tracefilename = reverse(@curr_tracefilename)
select @indx = PATINDEX('%\%', @curr_tracefilename)
set @curr_tracefilename = reverse(@curr_tracefilename)
set @base_tracefilename = LEFT( @curr_tracefilename,len(@curr_tracefilename) - @indx) + '\log.trc';

select EventCat.name as Category, EventID.name as EventName, Events.*
from ::fn_trace_gettable( @base_tracefilename, default ) Events
inner join sys.trace_events EventID
on Events.EventClass = EventID.trace_event_id
inner join sys.trace_categories EventCat
on EventID.category_id = EventCat.category_id

end

Once I have all the trace data available in my Power Pivot table, I created calculated columns for Day, Hour and Minute. Now that I have all the data readily available for me, I went about creating the main dashboard which provides a view of all the events that occurred along with a time line view. All this took me less than 5 minutes after I had finished writing the query! Pretty quick. Now I have an interactive report that I can use for performing various kinds of analysis.

The screenshot below will show that there was only one event raised for the Server event category and the actual time of occurrence is shown in the line graph. A simple mouse over on the point will give you the exact details. Now isn’t that a simple way to track down events! Smile

image

I will provide a final version of the Excel sheet once I have completed the other dashboards and sanitized the information available in the Power Pivot table.

Another day at the SQL Bangalore UG Meeting

Another Saturday and another Bangalore SQL UG meeting completed! The turnout on a Saturday morning was really good. This time around the event was a bit different as we had a session on Photography by Vijay [T: @msigeek | B: iClickD]. This week’s User Group meeting was dedicated to SQL Server Tips and Tricks with Balmukund Lakhani [T: @blakhani | B: sqlserver-help] and me presenting on Management Studio and Power Pivot and Power View in Excel 2013.

Balmukund’s session as always was a superb hit where he demonstrated more than a fair share of SSMS tips and tricks. I am sure every one at the event learnt atleast a new thing about SSMS. There are multiple hidden options under the Tools->Options view in SSMS.

Vijay delivered a great session on photography which was very well appreciated by the audience!!

My session was around the the usage of Power View and Power Pivot in Excel 2013. I demonstrated how easy it was to build visualizations with Excel 2013 for administrators. I also demoed the Excel sheet that I had created using the System Health Session data. All my blog posts on this topic are available below.

PowerView and System Health Session–CPU health

PowerView and System Health Session–Scheduler Health

PowerView and System Health Session–SQL Memory Health

PowerView and System Health Session– IO Health

PowerView and System Health Session– System

The Excel file can be downloaded from Sky Drive using the link: http://sdrv.ms/10O0udO The presentation that I used for my session is available at SlideShare and also embedded below.

PowerView and System Health Session– System

Previous posts in this series:

PowerView and System Health Session–CPU health

PowerView and System Health Session–Scheduler Health

PowerView and System Health Session–SQL Memory Health

PowerView and System Health Session– IO Health

In the last post for this series, I had explained how to retrieve the I/O statistics from the System Health Session data. In this post, I will describe how to build a dashboard using the SYSTEM component of the sp_server_diagnostics output. This view will help DBAs track various errors which can get their blood pressure shooting to abnormal levels. The SYSTEM component tracks various errors like non-yielding conditions, latch related warnings, inconsistent pages detected and access violations for the SQL Server instance.

Armed with this information in a Power Pivot table, I created two calculated columns for DAY and HOUR on the time the event was reported. After that I created KPIs on the maximum number of non-yielding conditions, latch related warnings, inconsistent pages and access violations reported.

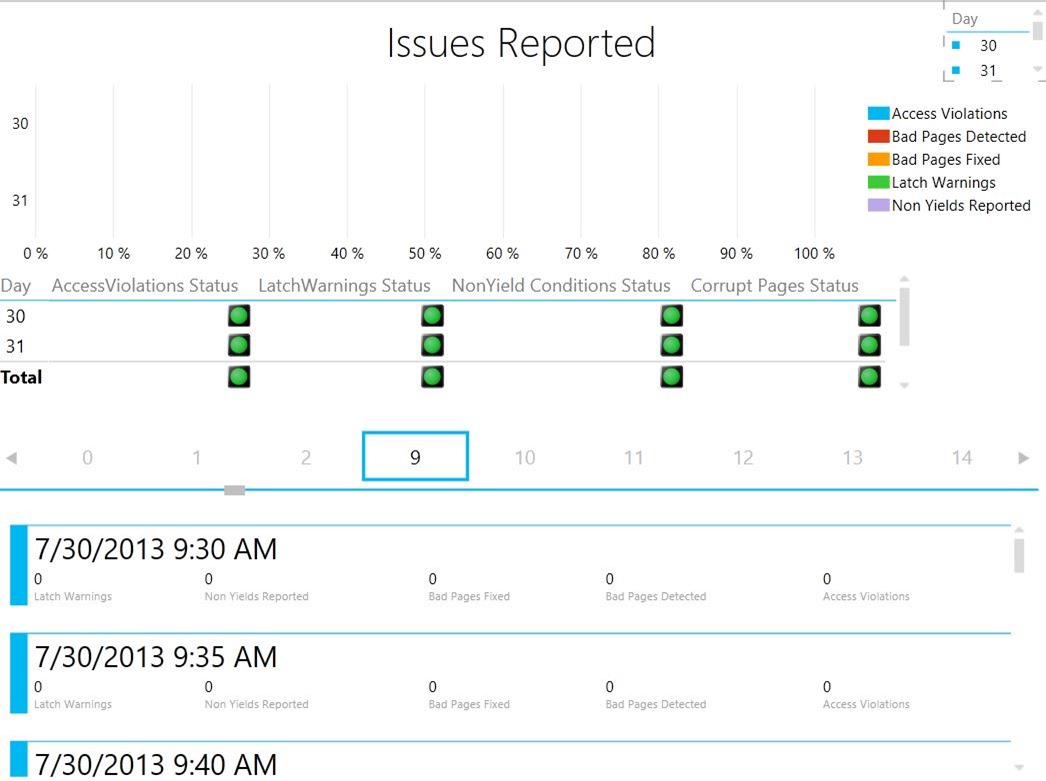
Now that I have my Power Pivot data, I created a new Power View sheet which tracks the created KPIs for each day and hour. The screenshot below shows the final view.

The first half is a 100% Stacked Bar graph showing the various errors that were reported each day. There is a slicer for Day available which allows to filter the data quickly.

The second half of the report is a matrix which shows the KPI status for which day with a drill-down capability for hour.

The third half of the report shows a card view with the actual number of issues reported for each event against a particular time.

As usual the Excel sheet is available on SkyDrive at: http://sdrv.ms/10O0udO

Issue Statistics

The query to fetch the data required to build this report is available below.


SET NOCOUNT ON

-- Fetch data for only SQL Server 2012 instances

IF (SUBSTRING(CAST(SERVERPROPERTY ('ProductVersion') AS varchar(50)),1,CHARINDEX('.',CAST(SERVERPROPERTY ('ProductVersion') AS varchar(50)))-1) >= 11)

BEGIN
-- Get UTC time difference for reporting event times local to server time

DECLARE @UTCDateDiff int = DATEDIFF(mi,GETUTCDATE(),GETDATE());

-- Store XML data retrieved in temp table

SELECT TOP 1 CAST(xet.target_data AS XML) AS XMLDATA

INTO #SystemHealthSessionData

FROM sys.dm_xe_session_targets xet

JOIN sys.dm_xe_sessions xe

ON (xe.address = xet.event_session_address)

WHERE xe.name = 'system_health'

AND xet.target_name = 'ring_buffer';

-- Parse XML data and provide required values in the form of a table

;WITH CTE_HealthSession (EventXML) AS

(

SELECT C.query('.') EventXML

FROM #SystemHealthSessionData a

CROSS APPLY a.XMLDATA.nodes('/RingBufferTarget/event') as T(C)

)

SELECT

DATEADD(mi,@UTCDateDiff,EventXML.value('(/event/@timestamp)[1]','datetime')) as [Event Time],

EventXML.value('(/event/data/text)[1]','varchar(255)') as Component,

EventXML.value('(/event/data/value/system/@latchWarnings)[1]','bigint') as [Latch Warnings],

EventXML.value('(/event/data/value/system/@isAccessViolationOccurred)[1]','bigint') as [Access Violations],

EventXML.value('(/event/data/value/system/@nonYieldingTasksReported)[1]','bigint') as [Non Yields Reported],

EventXML.value('(/event/data/value/system/@BadPagesDetected)[1]','bigint') as [Bad Pages Detected],

EventXML.value('(/event/data/value/system/@BadPagesFixed)[1]','bigint') as [Bad Pages Fixed]

FROM CTE_HealthSession

WHERE EventXML.value('(/event/@name)[1]', 'varchar(255)') = 'sp_server_diagnostics_component_result'

AND EventXML.value('(/event/data/text)[1]','varchar(255)') = 'SYSTEM'

ORDER BY [Event Time];

DROP TABLE #SystemHealthSessionData

END