Default Trace–Performance Issues

There are multiple events that a default trace in SQL Server 2005 and above tracks which can be significantly useful for finding out areas of improvement. The events that I will be concentrating on are:

1. Missing Column Statistics – This event class indicates that column statistics that could have been useful for the optimizer are not available due to which an incorrect cardinality estimation could occur. This can cause the optimizer to choose a less efficient query plan than expected. You will not see this event produced unless the option to auto-create statistics is turned off.

2. Missing Join Predicate – This event class indicates that a query is being executed that has no join predicate. (A join predicate is the ON search condition for a joined table in a FROM clause.) This could result in a long-running query. This event is produced only if both sides of the join return more than one row.

3. Sort Warnings – This event class indicates that sort operations do not fit into memory. This does not include sort operations involving the creation of indexes, only sort operations within a query (such as an ORDER BY clause used in a SELECT statement). The EventSubClass field in this event shows whether this was a single pass or a multiple pass. A single pass (EventSubClass = 1) is when the sort table was written to disk, only a single additional pass over the data was required to obtain sorted output. A multiple pass (EventSubClass = 2) is when the sort table was written to disk, multiple passes over the data were required to obtain sorted output. A multiple pass is an enemy of query performance.

4. Hash Warnings – This event class can be used to monitor when a hash recursion or cessation of hashing (hash bailout) has occurred during a hashing operation.  Hash recursion (EventSubClass = 0) occurs when the build input does not fit into available memory, resulting in the split of input into multiple partitions that are processed separately. Hash bailout (EventSubClass = 1) occurs when a hashing operation reaches its maximum recursion level and shifts to an alternate plan to process the remaining partitioned data. Hash bailout usually occurs because of skewed data. Another enemy of performance!

5. Server Memory Change – This event class occurs when Microsoft SQL Server memory usage has increased or decreased. You can even determine what is the current memory usage after the increase or decrease.

6. Log File Auto Grow – This event class indicates that the log file grew automatically. This event is not triggered if the log file is grown explicitly through ALTER DATABASE. Frequent log file growths are not food for performance.

7. Data File Auto Grow – This event class indicates that the data file grew automatically. This event is not triggered if the data file is grown explicitly by using the ALTER DATABASE statement.

Since this information is already available in the default trace, I decided to use my Default Trace Statistics Power View Excel sheet to track this information graphically. And this is what I got (see screenshot 1)!

DefaultTrace_PerfIssues

So what is the above Excel sheet displaying?

1. The information available in the first column chart will show the Data and Log file grow events per database.

2. The first matrix in the middle of the Excel sheet shows the number of Sort Warnings and Hash Warnings with drill-down capabilities for each database to see the EventSubClass fields.

3. The second matrix shows the Missing Column Statistics and the Missing Join Predicate events for each database. The drill-down capability gives the name of the column statistics that was missing.

4. The line graph shows the change in memory for the SQL Server database engine.

Happy monitoring!

Previous posts in this series:

Schema Changes History Report

Advertisement

WOOT: Schema Changes History Report on Power View

The last post in this series talked about using Power View to analyze the data stored in the SQL Server’s default trace. I decided to take this a step further by creating the Schema Changes History report with the help of the data that I retrieved from the Default Traces. The advantage of a report created in Power View is that the interactivity which is missing in the standard report is available.

The way I created this report was to filter the data in the Power Pivot table using EventClass ID 46, 47 and 164 for only looking at the create, drop and alter commands which the default trace tracks. After that I created a table with a tile on the Database Name and a 100% Stacked Bar Chart to show the activity at a database level.

I also had to create linked tables for getting the Object Type and the Event Class Name that you see in the table below.

I will provide a final version of the Excel sheet once I have completed the other dashboards and sanitized the information available in the Power Pivot table.

SchemaChangesHistory

Previous Post in the Series:

Default Trace Dashboard
https://troubleshootingsql.com/2013/09/26/woot-default-trace-and-power-view/

WOOT: Default Trace and Power View

I have been working on building visualizations for various kinds of analysis that I perform for my customers. One such useful visualization was the use of Power View for analyzing the data available in the SQL Server Default Trace. The query below lets you retrieve all the information in the default traces. This same query is used to populate the Power Pivot table in the Excel file.


declare @enable int

-- Check to find out if Default Server Side traces are running
select top 1 @enable = convert(int,value_in_use) from sys.configurations where name = 'default trace enabled'

if @enable = 1 --default trace is enabled
begin

declare @d1 datetime;
declare @diff int;
declare @curr_tracefilename varchar(500);
declare @base_tracefilename varchar(500);
declare @indx int ;

select @curr_tracefilename = path from sys.traces where is_default = 1 ;

set @curr_tracefilename = reverse(@curr_tracefilename)
select @indx = PATINDEX('%\%', @curr_tracefilename)
set @curr_tracefilename = reverse(@curr_tracefilename)
set @base_tracefilename = LEFT( @curr_tracefilename,len(@curr_tracefilename) - @indx) + '\log.trc';

select EventCat.name as Category, EventID.name as EventName, Events.*
from ::fn_trace_gettable( @base_tracefilename, default ) Events
inner join sys.trace_events EventID
on Events.EventClass = EventID.trace_event_id
inner join sys.trace_categories EventCat
on EventID.category_id = EventCat.category_id

end

Once I have all the trace data available in my Power Pivot table, I created calculated columns for Day, Hour and Minute. Now that I have all the data readily available for me, I went about creating the main dashboard which provides a view of all the events that occurred along with a time line view. All this took me less than 5 minutes after I had finished writing the query! Pretty quick. Now I have an interactive report that I can use for performing various kinds of analysis.

The screenshot below will show that there was only one event raised for the Server event category and the actual time of occurrence is shown in the line graph. A simple mouse over on the point will give you the exact details. Now isn’t that a simple way to track down events! Smile

image

I will provide a final version of the Excel sheet once I have completed the other dashboards and sanitized the information available in the Power Pivot table.

PowerView and System Health Session– System

Previous posts in this series:

PowerView and System Health Session–CPU health

PowerView and System Health Session–Scheduler Health

PowerView and System Health Session–SQL Memory Health

PowerView and System Health Session– IO Health

In the last post for this series, I had explained how to retrieve the I/O statistics from the System Health Session data. In this post, I will describe how to build a dashboard using the SYSTEM component of the sp_server_diagnostics output. This view will help DBAs track various errors which can get their blood pressure shooting to abnormal levels. The SYSTEM component tracks various errors like non-yielding conditions, latch related warnings, inconsistent pages detected and access violations for the SQL Server instance.

Armed with this information in a Power Pivot table, I created two calculated columns for DAY and HOUR on the time the event was reported. After that I created KPIs on the maximum number of non-yielding conditions, latch related warnings, inconsistent pages and access violations reported.

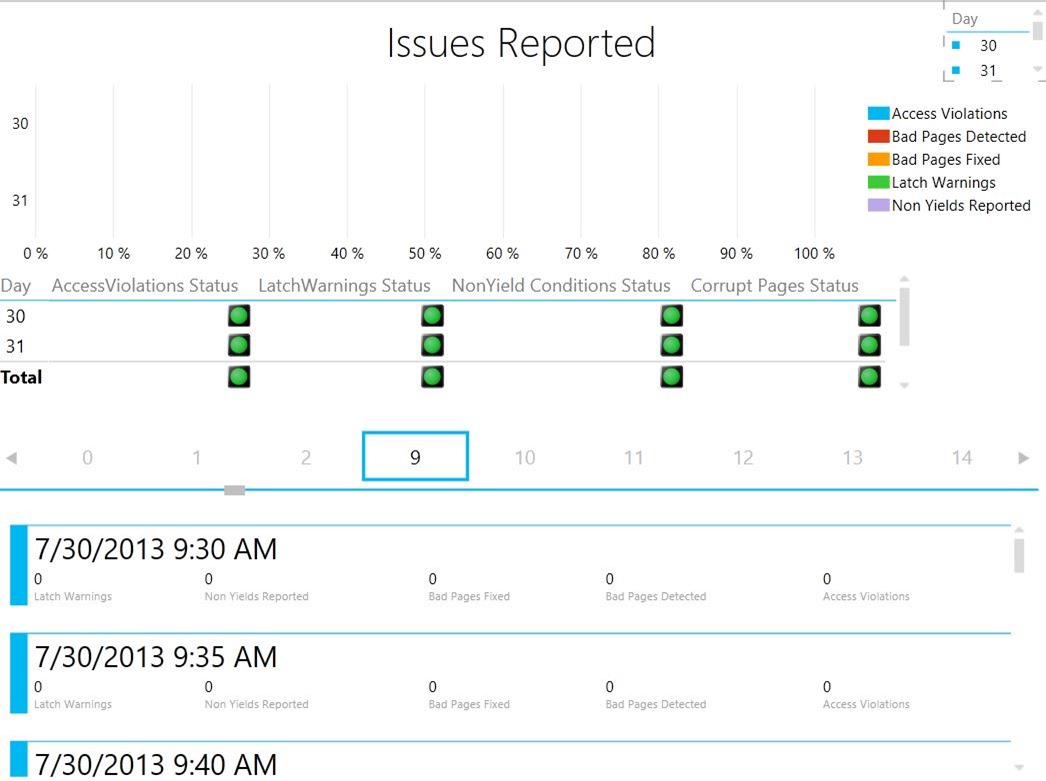
Now that I have my Power Pivot data, I created a new Power View sheet which tracks the created KPIs for each day and hour. The screenshot below shows the final view.

The first half is a 100% Stacked Bar graph showing the various errors that were reported each day. There is a slicer for Day available which allows to filter the data quickly.

The second half of the report is a matrix which shows the KPI status for which day with a drill-down capability for hour.

The third half of the report shows a card view with the actual number of issues reported for each event against a particular time.

As usual the Excel sheet is available on SkyDrive at: http://sdrv.ms/10O0udO

Issue Statistics

The query to fetch the data required to build this report is available below.


SET NOCOUNT ON

-- Fetch data for only SQL Server 2012 instances

IF (SUBSTRING(CAST(SERVERPROPERTY ('ProductVersion') AS varchar(50)),1,CHARINDEX('.',CAST(SERVERPROPERTY ('ProductVersion') AS varchar(50)))-1) >= 11)

BEGIN
-- Get UTC time difference for reporting event times local to server time

DECLARE @UTCDateDiff int = DATEDIFF(mi,GETUTCDATE(),GETDATE());

-- Store XML data retrieved in temp table

SELECT TOP 1 CAST(xet.target_data AS XML) AS XMLDATA

INTO #SystemHealthSessionData

FROM sys.dm_xe_session_targets xet

JOIN sys.dm_xe_sessions xe

ON (xe.address = xet.event_session_address)

WHERE xe.name = 'system_health'

AND xet.target_name = 'ring_buffer';

-- Parse XML data and provide required values in the form of a table

;WITH CTE_HealthSession (EventXML) AS

(

SELECT C.query('.') EventXML

FROM #SystemHealthSessionData a

CROSS APPLY a.XMLDATA.nodes('/RingBufferTarget/event') as T(C)

)

SELECT

DATEADD(mi,@UTCDateDiff,EventXML.value('(/event/@timestamp)[1]','datetime')) as [Event Time],

EventXML.value('(/event/data/text)[1]','varchar(255)') as Component,

EventXML.value('(/event/data/value/system/@latchWarnings)[1]','bigint') as [Latch Warnings],

EventXML.value('(/event/data/value/system/@isAccessViolationOccurred)[1]','bigint') as [Access Violations],

EventXML.value('(/event/data/value/system/@nonYieldingTasksReported)[1]','bigint') as [Non Yields Reported],

EventXML.value('(/event/data/value/system/@BadPagesDetected)[1]','bigint') as [Bad Pages Detected],

EventXML.value('(/event/data/value/system/@BadPagesFixed)[1]','bigint') as [Bad Pages Fixed]

FROM CTE_HealthSession

WHERE EventXML.value('(/event/@name)[1]', 'varchar(255)') = 'sp_server_diagnostics_component_result'

AND EventXML.value('(/event/data/text)[1]','varchar(255)') = 'SYSTEM'

ORDER BY [Event Time];

DROP TABLE #SystemHealthSessionData

END

TroubleshootingSQL Bytes–CPU usage analysis with Excel 2013

A screencast showing the CPU usage statistics of a SQL Server 2012 instance retrieved using Power Pivot. The visualization has been built using Power View in Excel 2013. The nuts and bolts of how the visualization was created is available in the following blog post: PowerView and System Health Session–CPU health

TroubleshootingSQL–CPU usage analysis with Excel 2013