I had blogged about retrieving deadlock related information using the default Extended Event session which runs by default on all SQL Server 2008 instances and above. However, once you have retrieved the XML deadlock graph, it could be quite cumbersome to read if the deadlock happens to be complex or involves multiple nodes. I frequently require the need to fetching the information about past deadlocks from the System Health Session data while working on customer environments. Due to the frequent repetitive nature of the data collection, I decided to automate this task.
I again decided to use a combination of Powershell and T-SQL to extract this information. The Powershell script (TransformtoXDL.ps1), which requires Powershell 2.0 or above, uses a T-SQL script (TransformtoXDL.sql ) to extract data from the System Health Session and outputs each individual deadlock graph as a separate .XDL file into a folder of your choice with the timestamp of the occurrence of the deadlock. Note that the time reported will be in GMT timezone.
The powershell script accepts two parameters: vServername for the SQL Server instance that you want to extract the data from and the vPath for the folder into which the XDL files should be saved into.
.\TransformToXDL.ps1 -vServername "<server name>" -vPath "C:\Tempdb\"
Yes… I have a folder called Tempdb on my C: drive!! 
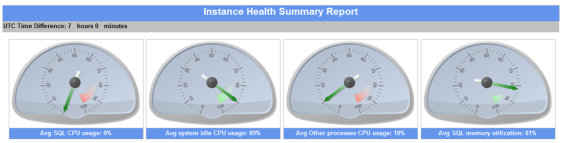
A sample output is shown in the screenshot below:

The Transact-SQL script called TransformtoXDL.sql does the following:
1. Extracts the System Health Session data into a temporary table
2. Based on the version of your SQL Server instance, it performs the parsing to extract the deadlock graph. This script accounts for issues mentioned in KB978629. I would like to thank Michael Zilberstein [B] for the proposed corrective action on an issue that Jonathan Kehayias [B|T] had blogged about.
3. The last action that the script takes is to perform XML modification to get the XML deadlock data in the same format which is recognized by SQL Server 2012 Management Studio when viewing XDL files.
The powershell and T-SQL script can be downloaded here.
#    Script Name: TransformToXDL
#    Author: Amit Banerjee
#    Date: September 6, 2012
#    Description:
#    The script reads the deadlock graphs from the System Health Session
#    Ring Buffer and parses them to create an individual deadlock graph
#    in a folder of your choice.
#    Usage: .\TransformToXDL.ps1 -vServername "INST1" -vPath "C:\Tempdb\"
# This Sample Code is provided for the purpose of illustration only and is not intended to be used in a production environment. THIS SAMPLE CODE AND ANY RELATED INFORMATION ARE PROVIDED "AS IS" WITHOUT WARRANTY OF ANY KIND, EITHER EXPRESSED OR IMPLIED, INCLUDING BUT NOT LIMITED TO THE IMPLIED WARRANTIES OF MERCHANTABILITY AND/OR FITNESS FOR A PARTICULAR PURPOSE. We grant You a nonexclusive, royalty-free right to use and modify the Sample Code and to reproduce and distribute the object code form of the Sample Code, provided that You agree: (i) to not use Our name, logo, or trademarks to market Your software product in which the Sample Code is embedded; (ii) to include a valid copyright notice on Your software product in which the Sample Code is embedded; and (iii) to indemnify, hold harmless, and defend Us and Our suppliers from and against any claims or lawsuits, including attorneys’ fees, that arise or result from the use or distribution of the Sample Code.

Param ([string] $vServername,
[string] $vPath)

cls

# Load the SQL Server snap-in for using sqlcmd cmdlet
$ErrorActionPreference = "SilentlyContinue"
Import-Module sqlps
$ErrorActionPreference = "Continue"

Write-Host "`nConnecting to SQL Server instance " $vServerName " to extract deadlock information"
# Extract the deadlock graphs and parse them in the system health session
Invoke-Sqlcmd -InputFile "C:\Tempdb\TransformToXDL.sql" -ServerInstance $vServerName

# Function to get the information from the table stored in tempdb
function Get-SqlData
{
param(
[string]$serverName=$(throw 'serverName is required.'),
[string]$databaseName,
[string]$query
)

$connString = "Server=$serverName;Database=$databaseName;Integrated Security=SSPI;"
$da = New-Object "System.Data.SqlClient.SqlDataAdapter" ($query,$connString)
$dt = New-Object "System.Data.DataTable"
[void]$da.fill($dt)
$dt

}

# Get the data stored in tempdb using the function defined above
$rows = get-sqldata $vServername  "tempdb"  "select row_id,event_time,deadlockgraph from tempdb.dbo.deadlock_graphs"

$vCount = 0
# Extract each row retrieved into an individual XDL file with the timestamp of the issue
foreach ($row in $rows)
{
if($row -ne $null)
{
$vCount++
$vFileName = $vPath + $vServername.Replace("\","_")+ "_" + $row.event_time.ToString().Replace(":","_").Replace("/","_") + ".xdl"
Write-Host "`nCreating file: "  $vFileName
$row.deadlockgraph | Out-File $vFileName
}
}

Write-Host "`nDeadlocks found: " $vCount.ToString()
Write-Host "`nPerforming cleanup"
Invoke-Sqlcmd -Query "IF EXISTS (SELECT TOP 1 name FROM tempdb.sys.objects where name = 'deadlock_graphs')
BEGIN
DROP TABLE tempdb.dbo.deadlock_graphs
END" -ServerInstance $vServerName
The above has been tested on SQL Server 2008, SQL Server 2008 R2 and SQL Server 2012. The resulting XDL files can be opened in SQL Server 2012 Management Studio. I am always looking for feedback. So please feel free to Tweet, Facebook or Email me regarding any issues or enhancements that you might need for the same.
You might want to remember that the T-SQL query used is a resource intensive query and it is preferable that you run this extraction exercise during non-business hours especially if your SQL Server instance is experiencing a large number of deadlocks.


 I have added UTC time formatting so that the time is shown in the same time zone based on the server on which you are viewing the report.

