Some facts about the Database Recovery Advisor and Restores

A new feature in SQL Server 2012 Management Studio is the Database Recovery Advisor. So why am I writing a post on a SQL Server 2012 enhancement which has been blogged already. Database Recovery Advisor There are some unique nuances that you need to be aware of while using this new utility. The Database Recovery Advisor facilitates constructing restore plans that implement optimal correct restore sequences.

Read on if you are interested in learning more about the Disaster Recovery Advisor. I will be referring to the Database Recovery Advisor as DRA in this post going forward.

The facts mentioned in this post are answers for frequently asked questions about DRA that I get from customers.

Continue reading

Fluffy in an Availability Group Failover Scenario

Over the past month or so, I have been dealing with a lot of questions around the troubleshooting failover scenarios for Availability Groups. So I decided that it is now time for me to pen down a post on the data to be collected and analysis options for digging into the root cause for an Availability Group. I did have time on my hands and decided to induce a Hollywood element into this post as well. The availability group name that I would be using in this post is named as Fluffy. Fluffy has two secondary Availability Replicas: one synchronous and the other one an asynchronous replica.

As you can see in the screenshot below, I had initiated a failover for my Availability Group and the AlwaysOn
Extended Events sessions shows a state change. The Extended Events session writes to a target file (.xel) which is present in the SQL Server LOG folder.

The Extended Event session runs by default when an Availability Group is configured on the SQL Server instance. The following extended events are captured by the Event Session:

  • sqlserver.alwayson_ddl_executed,
  • sqlserver.availability_group_lease_expired,
  • sqlserver.availability_replica_automatic_failover_validation,
  • sqlserver.availability_replica_manager_state_change,
  • sqlserver.availability_replica_state_change,
  • sqlserver.error_reported

Note that the Extended Events session will only track the state changes for the local replica. The Extended Events session is NOT a global store for all the state change events for all replicas!

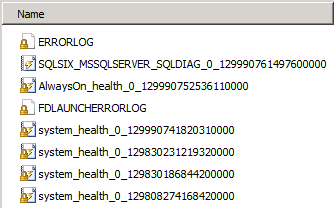
The previous set of logs that you collect from the SQL Server failover cluster instances like the SQL Errorlog, Cluster log and Windows Event logs are still applicable for root cause analysis for failovers. However, now you have additional logs in the SQL Server LOG folder which can assist with a root cause analysis for failover issues. The screenshot below shows two new files that would be of interest when analyzing SQL Server failovers namely, the AlwaysOn_health_* and <server name>_<instance name>_SQLDIAG_* logs. The first set of files are the AlwaysOn Extended Events logs and the second set of logs are called the Failover Cluster Instance Diagnostics Log.

We already saw from the above screenshot what the AlwaysOn Extended Events health session can track. Now, let’s see what the Failover Cluster Instance Diagnostics Log collects. There will be multiple informational messages about the activities performed against the Availability Group. Additionally, there will be messages pertaining to the sp_server_diagnostics data (component_health_resultset) collection and the Availability Group state change (availability_group_state_change).

The T-SQL query below can help you fetch the state change information for your SQL Server instance. Again, this is specific to the instance from which you fetched the failover cluster instance diagnostics log:

select object_name,cast(event_data as xml) as xmldata
from sys.fn_xe_file_target_read_file('<file name/path>', null, null, null)
where object_name = 'availability_group_state_change'

A snippet of the XML data retrieved using the above query for the manual failover that I had done is shown below:

<data name=”target_state“>
<
value>2</value>
<text>Online</text>
</data>
<data name=”failure condition level“>
<value>3</value>
<text >SYSTEM_UNHEALTHY</text>
</data>


<data name=”availability_group_name”>
<value>FLUFFY</value>
</data>

</event>


In summary, the following sets of logs need to be collected from all the Availability Replicas:

  1. SQL Server Errorlog from the time of the failure
  2. Windows Application and System Event logs from the time of the failure
  3. All the Failover Cluster Instance Diagnostics log (upto a maximum of 10 rollover .xel files by default)
  4. All the AlwaysOn Extended Event session log files (upto a maximum of 4 rollover .xel files by default)
  5. System Health Session Extended Event session files (optional as the component health state information is present in #4)
  6. Windows Cluster log

There are some useful queries in the Books Online topic for the failover cluster instance diagnostics log to parsing through the collected data.

Happy troubleshooting!!

P.S. The above blog post was created using a lab environment provided by SQL Server Virtual Labs. This is an online environment which allows you to create virtual machines to practice various SQL Server scenarios. The lab that I used was “SQL Server 2012: AlwaysOn Availability Groups (SQL 142).

Awesomesauce: Finding out missing sequences

Another of those #sqlhelp inspired posts. This was around ways to track down missing numbers in a sequence table. This task can be done in multiple ways and as I like to say that there are multiple ways to skin a cat! However, this blog post is about using the new T-SQL enhancements in SQL Server 2012 to figure out missing sequential numbers. I will demonstrate this using an example.

I have a table tblsequences which has two integer columns with the primary key being an int datatype. I did some random inserts into the table. The script below can be used to find out missing sequential numbers in an identity column or an integer column which is supposed to store sequential values.


-- Replace starting value with minimum starting value and increment for your sequence
-- Replace the table name with the table name that you are interested in
declare @startvalue int = 1, @increment int = 1
;with cte as
(
select a,(a-lag(a,1) OVER (ORDER BY a)) as MissingSequences
from tblsequences
)
select a, (MissingSequences/@increment)-1 as MissingSequences
from cte
where MissingSequences > @increment
union all
select TOP 1 MIN (a),
CASE (MIN(a)- @startvalue)/@increment
when 0 then null
else (MIN(a)- @startvalue)/@increment
end as MissingSequences
from tblsequences
group by a
order by a

The output is as shown below in the screenshot. You will notice that the first column reports the primary key value and the MissingSequences column reports the number of missing sequential values lesser than the value in the first column. You will need to make the necessary changes to the two scripts shown in this blog post so that the tables you want analyzed are done so.

image

Next, lets talk about Sequences which is a new feature in SQL Server 2012. I created a new sequence using the a start value of 10 and an increment value of 3.

I used the Sequence which was created for generating OrderID values in two different tables. Now we are posed with an interesting problem. I have two different tables in which I want to compare missing sequence numbers. This can be done with T-SQL code below.


-- Replace schema name, table name(s) and sequence name as appropriate
declare @startvalue int = 1,@interval int = 1, @seqname sysname = 'TestSeq', @schemaname sysname = 'dbo'
select @startvalue = TRY_CAST(TRY_CAST(start_value as varchar(255)) as int),
@interval = TRY_CAST(TRY_CAST(increment as varchar(255)) as int)
from sys.sequences
where name = @seqname and [schema_id] = (select [schema_id] from sys.schemas where name = @schemaname)

if (@startvalue IS NOT NULL and @interval IS NOT NULL)
begin
;with cte as
(
select OrderID,(OrderID-lag(OrderID,1) over (order by OrderID)) as MissingSequences
from
(select OrderId as OrderID
from tblTestSeq
union all
select OrderId as OrderID
from tblTestSeq_2) A
)
select OrderID, (MissingSequences/@interval)-1 as MissingSequences
from cte
where MissingSequences > @interval
union all
select TOP 1 OrderID,
CASE (MIN(OrderID)- @startvalue)/@interval
when 0 then null
else (MIN(OrderID)- @startvalue)/@interval
end as MissingSequences
from tblTestSeq
group by OrderID
order by OrderID
end
else

else
begin
PRINT 'CAST FAILED'
end


The logic used is the same as the logic when we were looking for missing sequences in identity/integer columns described in the first half of the post. However, since sequences can be used for one or more tables, I have used a UNION query to get all the columns together which use the same sequence object. The second result set of the output in the screenshot below shows the tables involved along with the sequential OrderIDs. As you can see below, there are 4sequence numbers missing  10, 13, 16 and 28. The first result set reports exactly that by notifying that there are 3 sequence ids missing lesser than 19 and 1 sequence number missing lesser than 31.

The output of the above T-SQL script is shown in the screenshot below.

image

Another way how T-SQL enhancements in SQL Server 2012 can make your life easier.

Happy T-SQL coding and a have a great weekend!

Awesomesauce: Deprecated Features usages

SQLServer:Deprecated Features is a performance object that is available since SQL Server 2005. The number of deprecated features have definitely increased since SQL Server 2005. In SQL Server 2012, there are a number of deprecated features whose use on your SQL Server 2012 instance can be determined through the use of this performance object.

Some of the common features that you might be interested in finding out the usage are DBCC REINDEX, DBCC SHOWCONTIG, DBCC INDEXDEFRAG. Once you have found the usage of these, you can find out which application uses this by looking up the SQL Server default trace.

Example:

declare @tracename nvarchar(4000)

select @tracename = path from sys.traces where id = 1
select TextData, StartTime, EndTime, spid, ServerName, HostName, error, SessionLoginName ,ApplicationName, TransactionID
from fn_trace_gettable(@tracename,default)
where EventClass = 116
and (TextData like '%showcontig%' or TextData like '%reindex%' or TextData like '%indexdefrag%') 

Download the T-SQL script to find out the deprecated features being used on your SQL Server 2012 instance using the script below.

Script name: Deprecated_Features.sql

The above is a good way to determine the use of deprecated features and which requires a change in your SQL Server environment.

References
Discontinued Engine Features in SQL Server 2012
http://msdn.microsoft.com/en-us/library/ms144262.aspx
Deprecated Engine Features in SQL Server 2012
http://technet.microsoft.com/en-us/library/ms143729(SQL.110).aspx

Awesomesauce: Perf Dashboard on Native SSRS

I had been asked the question about using the Perf Dashboard reports from a Reporting Services instance multiple times. Though this was not the intention of launching the SQL Server Performance Dashboard Reports but there is a compelling need at times to have these accessible from a web URL. In today’s age, you will find a lot of DBAs monitor their SQL Server instances remotely. Sometimes, there is another layer of complexity added to this when they want to just look at the health of the SQL Server instance by accessing a URL exposed through a corporate server in their environment. In such cases, you wouldn’t want to jump through a few hoops of setting up your VPN connection and blah blah.

So with all that in mind, let’s talk about how you can get your SQL Server 2012 Performance Dashboard to your existing SQL Server Reporting Services instance.

  • First you need to create a new Reporting Services Project using SQL Server Data Tools (SSDT).
  • Use the solution explorer to add all the existing performance dashboard reports from the C:\Program Files (x86)\Microsoft SQL Server\110\Tools\Performance Dashboard folder.
  • Modify the project properties to ensure that the data source gets written to the same folder as the reports.
  • Create a shared data source pointing to your SQL Server instance.
  • Open each report that was imported into the project and modify the data source properties to use the shared data source that you created in the above step.
  • Modify the project deployment properties as shown below.

image

Now you are ready to deploy your Performance Dashboard SSRS project to your reporting services instance.

What can you do next?

You can now set up Report Server subscriptions for the set of reports that you wish to receive via email. You can get a status report of your SQL Server instance without even having to lift a finger and that to right in your mailbox! Smile

Note that Performance Dashboard is a tool which is provided “AS-IS” by Microsoft. The steps mentioned above will help you deploy the existing Performance Dashboard reports to a SQL Server Reporting Services instance. However, the failure to deploy these reports as mentioned above is not liable for support by Microsoft SQL Server Support team.