Tools Tips and Tricks #12: XPerf, Memory usage and much more

This is the last post for the series Tools Tips and Tricks as May draws to a close. Today I shall talk about another tool that we use called XPerf for performance troubleshooting. Though this is not a common tool which is used on a regular basis by the SQL CSS team. But when we do decide to use this for very specific scenarios, the usefulness of this tool cannot be put in words. I had talked about using Debug Diag for monitoring memory usage and tracking down allocations right upto the function call. There is another way to track heap allocations which is what I shall be talking about today. I shall use the same MemAllocApp that I had used last week. I start off the Xperf monitoring using the following commands:

xperf -on PROC_THREAD+LOADER -BufferSize 1024 -MinBuffers 16 -MaxBuffers 16
xperf -start HeapSession -heap -Pids 9532 -BufferSize 1024 -MinBuffers 128 -MaxBuffers 128 -stackwalk HeapAlloc+HeapRealloc+HeapCreate

Now once I have collected the XPerf data, you can use the following command to stop the data collection:

xperf -stop HeapSession -stop –d F:\MemAlloc.etl

Once that is done, you should have an ETL file in the specified location by the –d parameter. Since, I am interested in the functions in the functions which were allocating the maximum amount of memory, I will use the following command to generate a summary report for the heap allocations traced by XPerf using the command below:

xperf -i "F:\MemAlloc.etl" -o "F:\MemAlloc.txt" -symbols -a heap -stacks -top 5

/* Output of MemAlloc.txt file */

Results for process MemAllocApp.exe (9532):

———————————————————————

GLOBAL ALLOCATIONS:
Alloc       :         100,     512000.0 KB
Realloc     :           0
Outstanding :         100,     512000.0 KB

———————————————————————

TOP 1:
Alloc       :         100,     512000.0 KB
Realloc     :           0
Outstanding :         100,     512000.0 KB

———————————————————————

MemAllocApp.exe!fn_allocatememory
MemAllocApp.exe!wmain
MemAllocApp.exe!__tmainCRTStartup
MemAllocApp.exe!wmainCRTStartup
kernel32.dll!BaseThreadInitThunk
ntdll.dll!RtlUserThreadStart

Alloc       :         100,     512000.0 KB
Realloc     :           0
Outstanding :         100,     512000.0 KB


As you can see from the above output, the function fn_allocatememory was responsible for 100 allocations worth 512KB each. With just the use of a single command I was able to figure out the reason behind my outstanding allocations for my EXE. Troubleshooting SQL Server outstanding memory allocations for heaps may not be as easy as this but it definitely saves time in having to look and dig out the allocations from the a memory dump.

This method is quite useful when you have a very large ETL file which you need to analyze. You can even configure a Circular Buffer for capturing data appending the following command for your HeapSession tracing commands:

-BufferSize 1024 -MaxBuffers 1024 -MaxFile 1024 -FileMode Circular

Note: Make sure that you set your _NT_SYMBOL_PATH environment variable correctly if you want the function calls to be resolved correctly.

Hope you enjoyed this series of Tools Tips and Tricks as much as I had fun in posting the various methods that I use to collect diagnostic data while troubleshooting SQL performance related issues.

References:
Using Actions to process Heap Data
Enabling Data Capture using XPerf
XPerf Options

Advertisement

Tools Tips and Tricks #11: Debug Diag and Memory leaks

This week I had shown how to use Debug Diagnostic tool to capture a dump for a first chance exception encountered by an application and perform analysis using the Crash Analysis rule. Today I am going to show to use Debug Diagnostic tool to track outstanding memory allocations for a process.

Steps

image1. Launch the Debug Diagnostic tool and click on the Rules tab. Click on Add Rule.

2. Select the Native (non-.NET) Memory and Handle Leak rule. (see screenshot on the right)

3. You cannot setup a memory leak tracking rule for a process that is not running as the Leak Tracking dll has to hook onto the imageprocess. In this example, I will be using the tool to track an executable called MemAllocApp.exe. Select the required process using the Select Target window. (see screenshot on the left)

4. In the next window titled “Configure Leak Rule”, you can use that to go granular with your tracking requirements. I have opted not to generate a dump after n minutes of tracking (Option: Generate final userdump after x minutes of tracking). I have selected an auto-unload of the Leak Tracking DLL once the rule is completed or deactivated (Option: Auto-unload Leak Track when rule is completed or deactivated). (see screenshot below)

5. Click on the Configure button and you can then configured additional options for the userdump generation for the process being tracked. I also have the tool set to automatically capture a user dump if the process that I am tracking unexpectedly shuts down. (Configure userdumps for Leak Rule window below in screenshot). I have configured the rule to capture a dump automatically if the process unexpectedly shuts down. (Option: Auto-create a crash rule to get userdump on unexpected process exit). Additionally, I have configured the rule to capture a userdump once the private bytes for the process reaches 350MB. (Option: Generate a userdump when private bytes reach x MB). As you can see in the screenshot below, there are additional options that you can configure but I don’t need them for this particular demo. image

6. Next you get the “Select Dump Location and Rule Name” window where you can changed the rule name and the location of the dumps generation. By default the dumps are generated at <Debug Diagnostic Install Path>\Logs\<Rule Name> folder.

7. Click on Activate Rule in the next window to start the tracking.image

Note: If you are not in the same session as the Debug Diag Service, then you will get the following message when you get the following pop-up, once you have configured the rule. Click on Yes. And then you should get a pop-up stating that Debug Diag is monitoring the EXE for leaks.

Process MemAllocApp.exe(15316) is in the same logon session as DebugDiag (session 2), but it is not in the same logon session as the DbgSvc service (session 0).  Do you want to return to ‘Offline Mode’ and continue?

On the Rules tab, you should see two rules. One for the leak tracking and the other for the crash rule. Once I hit the threshold of 350MB of privates bytes, I will a dump generated and the Userdump Count column value should change to 1. I was monitoring my application’s Private Bytes perfmon counter and the graph showed a steady increase. (see screenshot below). Now that the rule is active, I can find that the Being Debugged column has the value “Yes” and the LeakTrack Status column value will be Tracking for MemAllocApp.exe under the Processes tabs.image I then used the Analyze Data button under the Rules tab to generate the memory tracking report of a memory dump that I had captured earlier which I analyzed and these are a few excerpts from the report. image

The Analysis Summary tells me that I have outstanding memory allocations of 205MB. This dump was generated using a rule to capture a userdump when Private Bytes for the process exceeded 200MB. Next I shall look at the Virtual Memory Analysis Summary sub-heading…

image

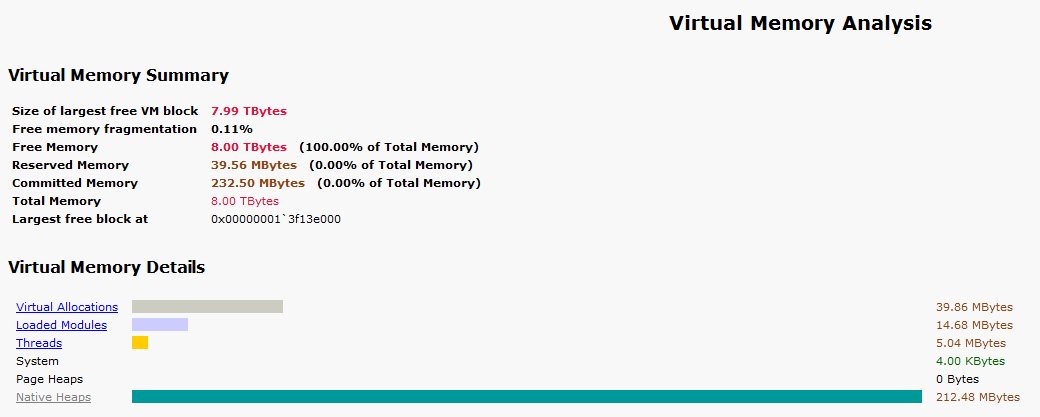
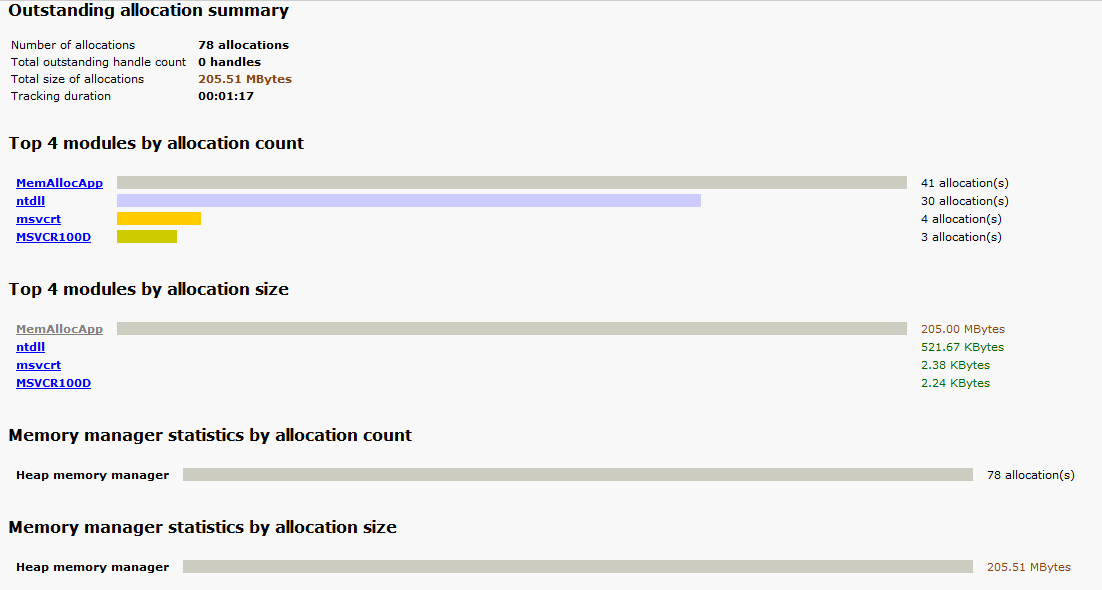
This clearly tells me that the memory allocations are coming from the Native Heaps. And I know from the previous screen-shot that Heap Allocation functions (HeapAlloc) is being called. Now digging into the Outstanding Allocation Summary, I find that over 200MB of allocations have been done from my application and all allocations have been done on the heap. In the Heap Analysis summary, I find that the allocations have all come in from the default process heap. Drilling down into the MemAllocApp hyperlink, I get the offset making these allocations which is MemAllocApp+2cbb. image

The function details from the report is available in the quoted text below. If I have the debug symbols of the application (which I do), I find that this corresponds to my function call fn_allocatememory which makes 5MB allocations using HeapAlloc on the default process heap. If you align your symbols correctly for the analysis, you will find that the report also gives you the correct function names.

Function details

Function
MemAllocApp+2cbb

Allocation type
Heap allocation(s)

Heap handle
0x00000000`00000000

Allocation Count
41 allocation(s)

Allocation Size
205.00 MBytes

Leak Probability
52%

So without any debugging commands, I was able to drill down to the culprit making the maximum number of allocations. This can be quite a useful way of tracking down non-BPool (commonly known as MemToLeave on 32-bit SQL instances) allocations when the Mutli Page Allocations don’t show a high count but you are experiencing non-BPool memory pressure.

The fn_allocationmemory function code is mentioned below:

void fn_allocatememory(int cntr)
{
printf("Sleeping for 10 seconds\n");
Sleep(10000);
BYTE* pByte=(BYTE*) HeapAlloc(GetProcessHeap(), 0, 5242880);
(*pByte)=10;
printf("Iteration %d: Allocating 5MB using HeapAlloc\n",cntr+1);
}

I used the same HeapAlloc function that Sudarshan had used in his latest blog post to explain behavior changes in Windows Server 2008 for tracking heap corruptions.

Tools Tips and Tricks #8 – Debug Diagnostic and Crash Rules

Screenshot 1There are multiple instances where you might need to collect a dump for a process which generates an Access Violation or just setup a crash rule for an application that crashes and that doesn’t generate a dump to investigate further. So today I am going to imagedemonstrate a way to capture a crash dump of a process using the Debug Diagnostic Tool. The example shown here can be extended to SQL Server as well. Once you launch the Debug Diagnostic Tool, you will notice that the tool has 3 different tabs namely Rule, Advanced Analysis and Processes.

I am now going to walkthrough setting up of a Crash Rule for an EXE called DebugDiag_CrashRule.exe which I had written to generate an Access Violation and then no exception handler written in the code which would result in a termination of the EXE.

The steps that you can use to setup the Crash Rule are:

1. Use the Rule tab and click on the Add Rule button. Select the option “Crash” in the Select Rule Type window and click on Next. (see screenshot on the left)
2. Then select “A specific process” option in the Select Target Type window and click on Next. (see screenshot on the right)
3. Next you are presented with an option to select a process from the list of active processes. imageI gave the process name in the Selected Processes text-box and didn’t select the “This process instance only” option. If you select this option, then the monitoring will be setup for only the particular instance that you have selected. If left unchecked, then the monitoring will be setup for any instance of the process spawned on the machine. (see screenshot on the right). Click on Next after you have given the appropriate process name or selected the process ID.
4. In the next screen “Advanced Configuration”, I clicked on the Exceptions button which lets you configure actions for First Chance Exceptions for the process being monitored. Click on the Add Exception button on the First Chance Exception Configuration window. Select Access Violation for the exception name and for the Action Type, select Full User Dump. The Action Limit that I have set in this case is 6 which means that after 6 dumps captured by this rule, no further dumps will be generated. This is a good way of limiting the number of dumps that will be generated for the process that you are monitoring. Notice that that Action type for unconfigured first chance exceptions is set to None. This means that for any first chance exception that is generated apart from the one that you have configured, no action will be taken by the rule. (see screenshot below).

imageimageimage

5. Next you get the “Select Dump Location and Rule Name” window where you can changed the rule name and the location of the dumps generation. By default the dumps are generated at <Debug Diagnostic Install Path>\Logs\<Rule Name> folder. (see screenshot on the left)
6. In the last window, use the Activate option to enable the rule.

Now that the rule is active, when I launch my EXE, I can find that the Being Debugged column has the value “Yes” for DebugDiag_CrashRule.exe under the Processes tabs. I launched my application once and this generated 2 dumps. The Rules tab will show you the rule configured, status of the rule and the number of dumps captured by the rule and the location of the dump. (see screenshot above)

Now that the data is captured, the tool allows you to perform Crash Analysis using the Advanced Analysis tab. Using the Analyze Data button, you can analyze the dump files together and get a HTML report of the dumps captured. The Analysis of the dumps generated should be done on a non-production machine to prevent an overhead of downloading symbols and performing the analysis. The symbol search path can be provided using the Tools –> Options and Settings –> Folders and Search Path tab. The symbol search path would be: SRV*<local folder>*http://msdl.microsoft.com/download/symbols. A local folder is always good to have so that the symbols used are cached locally if required later. This prevents having to connect to the Microsoft Symbol Server everytime you analyze a dump.

This is what I see in the DebugDiag_CrashRule__PID__3576__Date__05_24_2011__Time_12_59_56AM__612__First Chance Access Violation.dmp file. It tells me that Thread 0 generated the dump. As you can see in the screenshot below, the report gives you the call stack as well. The Exception information shows that an Access Violation was raised while trying to write to a memory location by a sprintf function called by the DebugDiag_CrashRule EXE.

Exception Information

In DebugDiag_CrashRule__PID__6476__Date__05_24_2011__Time_12_08_12AM__341__First Chance Access Violation.dmp the assembly instruction at msvcr100!vcwprintf_s+2f07 in C:\Windows\System32\msvcr100.dll from Microsoft Corporation has caused an access violation exception (0xC0000005) when trying to write to memory location 0x3f9721d0 on thread 0

image

The HTML report has a similar output for the DebugDiag_CrashRule__PID__3576__Date__05_24_2011__Time_12_59_57AM__647__Second_Chance_Exception_C0000005.dmp file as well. An additional file DebugDiag_CrashRule__PID__3576__Date__05_24_2011__Time_12_59_56AM__612__ProcessList.txt is also generated which contains a list of processes running on the machine when the dump was generated. All the reports are saved in the <Debug Diagnostic install path>\Reports folder by default.

Hope this makes it easier to capture crash dumps for processes which are terminating without giving you much information in the Windows event logs or the logs generated by the application. This is a tool that is commonly used by CSS to configure crash rules on a machine and capture crash dumps.

Once you have collected the required data, you can go to the Rules tab, right click on the rule and click on De-activate rule. Once the rule status shows up as Not Active, you can choose to remove the rule by right-clicking on the rule and selecting the Remove Rule option.

The Debug Diagnostic Tool v1.1 available on the Microsoft Downloads site doesn’t have a x64 version which lets you configure rules and monitor processes for Windows Server 2008/R2/Windows 7/Windows Vista. The 64-bit version of the tool only has Advanced Analysis option. The Debug Diagnostic Tool v1.2 available from here has a 64-bit download (Beta version) which allows to configure rules and monitor processes for Windows Server 2008/R2/Windows 7/Windows Vista.

TIP: Let’s talk about a quick tip about taking dumps of a SQL Server process using Debug Diagnostic tool. In case you find that your SQL Server process is hung and you cannot log into the SQL instance using Dedicated Administrator Connection (DAC) or don’t have DAC enabled for the instance, then you can take a mini-dump using the Processes tab.

Steps
1. Click on the Processes tab.
2. Right-click on the process name sqlservr.exe. If you have multiple instances, you can identify the correct instance using the Active Services column which will give you the instance name. (see screenshot below)
3. Right-click on the process name, click on Create Full Userdump or Create Mini Userdump option to generate a full or mini memory dump of the selected process. The dump location will be default location configured for the dump under Tools –> Options and Settings –> Folders and Search Path tab –> Manual Userdump Save Folder. By default it is <Debug Diagnostic install path>\Logs\Misc.image

imageYou might also encounter a situation where you are required to take a dump of a process every n seconds/minutes. This can be done by right clicking on the process name and selecting the Create Userdump series… option. This will give you a window with the set of options as seen in the screenshot on the left. As you can see, it lets you configure a number of options for the process namely:

1. Time interval between each dump created
2. When to start the timer, before or after the dump file writing completes.
3. When to stop generating the dumps
4. Whether to collect Full or Mini dumps
5. Option to collect a single Full user dump when a Mini-dump series is created for a process before or after the series is completed.

Tess Ferrandez [Blog], an Escalation Engineer in CSS, also has a pretty detailed blog post on how to setup a crash rule for ASP.NET applications.

Note: For a 64-bit process (eg. 64-bit SQL Server instance) which has a large process address space, it would be advisable to configure a User Mini Dump as the Exception action instead of a full-user dump. When a dump file is generated, the process threads are frozen to take a snapshot. For a large dump generation on a system with a slow Disk IO, you might end up with SQL outages and on a cluster it can result in a failover during the dump generation period.

Tools Tips and Tricks #7: PsExec as parent and ProcMon as child

A new week begins and the Tools, Tips and Tricks series continues. Today I shall talk about using PsExec (part of the PsTools package) to collect data from a remote box through PsExec. PsExec lets you execute processes on other systems without having to manually install client software.

The scenario that I will discuss today is collection of a Process Monitor trace on a server without logging onto the machine. This is quite useful if you need to collect a Process Monitor trace from one of the passive nodes while running SQL Server 2005 setup.

The .cmd file that I am using in this case has the following commands:


set PM=D:\ProcMon\procmon.exe

start %PM% /quiet /minimized /AcceptEULA /backingfile D:\ProcMon\notepad.pml

%PM% /waitforidle

ping 127.0.0.1 -n 10 -w 100

%PM% /terminate

I am running the .cmd file to spawn Process Monitor on a different server and capture a trace using a local file as the backing file. The reason why we would have to run Process Monitor from command line is because while running setup, it’s recommended that you do not log into the passive nodes using Terminal Services or Console Mode.

The command that I used to execute the commands present in the .cmd file is

PsExec \\<server name> -c RemoteProcMon.cmd

If you do not prefer the ping method to simulate waits, you can use the SLEEP utility available with Windows 2003 Resource Kit. This utility takes a parameter for milli-seconds to wait. If you need to set filters for Process Monitor, then run the Process Monitor tool in GUI mode and set the Filters and save it. After that Exit Process Monitor and run the above command from Command Line. Or you could alternatively create a configuration file and use the /LoadConfig command line switch for Process Monitor.

Again the possibilities are endless and you can extend this by using the command line options for PsExec and Process Monitor.

Use the options mentioned in Tools Tips and Tricks #1: Process Monitor so that the filters are correctly set and the page file doesn’t get overwhelmed if you are capturing data for long periods or on servers where there is high amount of activity.

Tools Tips and Tricks #5: SQLDIAG and RANU

During the course of the Tools Tips and Tricks series, I had blogged about how to connect to a RANU instance and how to find out the SQL Express user instances active on the machine. Today, I shall discuss how to use SQLDIAG to collect data from a SQL Express user instance.

Since a SQL Express User Instance involves the dynamic spawning of a new instance and connections are allowed locally only using named pipes, normal instance discovery doesn’t work. If you need to collect diagnostic data using SQLDIAG for such an instance, you need to take the following steps:

1. Start the user instance by instantiating a connection to the user instance from the application that uses it.
2. Use any method mentioned in my previous post to get the instance GUID and the named pipe string.
3. Construct a named pipe alias using SQL Server Configuration Manager (see screenshot below). Use SQL Native Client Configuration 32-bit or 64-bit as appropriate for your version of SQL Express.

image

The Alias Name is in the form of <server name>\<user instance GUID>. The pipe name is what you obtained for the user instance that you are interested in monitoring. Leaver the Server name as blank.
4. Once the alias is created, test if you can connect to it using SQLCMD –S:.\BA78E627-AD14-4 –E locally from the machine that has SQL Express installed on it.
5. Now in the SQLDIAG.XML configuration file that you are using put the server name and instance name as follows:

<Machine name=".">
….
<Instance name="BA78E627-AD14-4" windowsauth="true" ssver="10.5" user="">

After this you can run SQLDIAG from the machine which has SQL Express installed on it as user instances don’t accept remote connections.

Check back tomorrow for another new trick for tools that we use!