Category: Tech

Posts about tools, browsers, product tech, and general technology beyond pure data platforms.

  • Tools Tips and Tricks #3: Custom Rowsets using SQL Nexus

    This post is part three of the Tools Tips and Tricks series that I started last week. In my T-SQL Tuesday post for this month, I already explained how I always have the inclination of importing data collected into a SQL Server database. I shall touch upon this yet again but this time through the use of SQL Nexus. I am going to use a small script to collect data for the user requests which are executing queries against a particular SQL Server instance. The script that I used to collect data is shown below:

    
    set nocount on
    go
    
    while (1=1)
    begin
    
    print '-- RequestsRowset'
    
    select GETDATE() as runtime,a.session_id as session_id,
    a.start_time as start_time,
    a.[status] as [status],
    a.command as command,
    a.database_id as database_id,
    b.objectid
    from sys.dm_exec_requests a
    cross apply sys.dm_exec_sql_text(sql_handle) b
    where session_id <> @@spid
    
    raiserror ('', 0, 1) with nowait
    
    waitfor delay '00:00:05'
    end
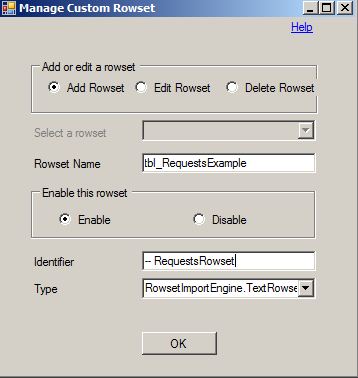


    I have stored the output captured by the above query in a file called CustomRowset.OUT. Using the Edit Custom Rowset option in the SQL Nexus UI (available in the third expandable tab named Data, on the left hand side), I can pull up a UI where I can specify the table name into which the data needs to be imported into (tbl_RequestsExample in this case) and the identifier for the data which needs to be imported (— RequestsRowset in this case). I was executing a WAITFOR DELAY command from another session while the above script was capturing data. I then import the data into a SQL Nexus database using the Importoption. Once this is done, I can then query the database and look into the results which were imported into the database. (see screenshot below). You can extend this functionality to any degree you want and even combine multiple T-SQL commands to capture different result sets in the same loop. You just need to make sure that the rowset identifier for each query result set is unique.

    Additionally, if you attempt to capture outputs which have columns with data type length greater than 8000, then the import will fail with the following error in the SQL Nexus log file:

    SQLNexus Information: 0 : RowsetImportEngine Error: An unexpected error has occurred:

    System.Data.SqlClient.SqlException: The size (8192) given to the column ‘query_text’ exceeds the maximum allowed for any data type (8000).

    SQL Nexus 3.0 doesn’t give you the option to add your own column data types using the UI.  Using the form (shown on the left) will treat all columns as varchar. If you want to change this behavior, then modify C:\Users\<user name>\AppData\Roaming\sqlnexus\TextRowsetsCustom.xml directly to add or modify the data types that you want.

    Where is this helpful?
    Let’s say I decided to collect the output of customized T-SQL script for an extended period of time. Instead of scouring the .txt or .out file manually using a text editor, I can import the data into a table and then run queries on them to save yourself a hair-raising experience and valuable time!

    How do I make sure that the data is imported correctly?
    1. If you have data which is larger than varchar(8000) in the result sets collected, then make sure to modify the TextRowsetsCustom.xml before you import the data.
    2. Give each rowset that you collect an unique identifier. You don’t want the importer to mix-n-match the data you are importing.
    3. Add a runtime column using GETDATE() or a variable for scripts capturing data in a loop to ensure that you can track the trend easily without having to second-guess.
    4. All columns that are collected in the result set(s) have to be named.
    5. Avoid CR/LFs in the result set i.e. don’t use CHAR(13) in your T-SQL script while capturing the data as this seriously confuses the importer as it treats CR/LFs as end-of-row indicator.
    6. Either capture the data directly into a file by running the data collection script from Management Studio or use sqlcmd -W parameter if you are capturing the data using sqlcmd. -W ensures that trailing spaces from the result sets are removed.

    That is all I have for today. Happy customizing and importing!

  • Tools Tips and Tricks #2: SQL Express RANU instances

    Recently I had worked on an issue with Run As User Instances a.k.a. RANU. The user instance, also known as a child or client instance, is an instance of SQL Server that is generated by the parent instance (the primary instance running as a service, such as SQL Express edition) on behalf of a user. The user instance runs as a user process under the security context of that user. The user instance is isolated from the parent instance and any other user instances running on the machine. The user instance feature is also referred to as “Run As Normal User” (RANU). This is not a feature of SQL Server that is common knowledge to most people in the SQL realm. Note the following mention in BOL for the topic “User Instances for Non-Administrators”:

    This feature will be removed in a future version of Microsoft SQL Server. Avoid using this feature in new development work, and plan to modify applications that currently use this feature.

    Why did I decide to talk about a SQL Server feature in a series that I am running on my blog related to tools. Well, this post is about connecting to a RANU instance and the tools available to do this. But this is a lesser known beast, I had to set some context first. Smile

    User instances are created when the “User Instance option” is set in the SQL Client connection string. Following is a section of a Visual Basic configuration file that shows the User Instance option:

    <connectionStrings>
    <add name=”TestVB1.Settings.Database1ConnectionString” connectionString=”Data Source=.\SQLEXPRESS; AttachDbFilename=|DataDirectory|\Database1.mdf; Integrated Security=True; User Instance=True” providerName=”System.Data.SqlClient” />
    </connectionStrings>

    How can I find out if there are RANU/User Instances running on the machine?

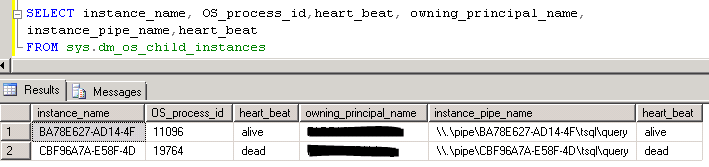
    On the SQLEXPRESS instance, the configuration option “user instances enabled” in should be enabled. Then execute the query shown in the screenshot below against the SQLEXPRESS instance:

    image

    The heart_beat column value will tell you is the instance is online or not. For an online instance, the heart_beat will have a value set to alive. RANU instances allow only local Named Pipe connections. So there are three ways how you can connect to a RANU instance:

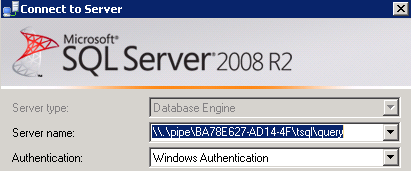
    1. Using Management Studio

    image

    a. Launch a Management Studio on the machine where the SQL Express instance is running.
    b. In the Connect to Server dialog box, you will have to specify the instance_pipe_name value obtained from the above output as the Server Name.

    2. Using SQLCMD

    Using the sqlcmd utility, you can also connect using the pipe name in the following manner:

    sqlcmd -Snp:\\.\pipe\BA78E627-AD14-4F\tsql\query -E

    3. Using SQL Server Express Utility

    This is a utility available on the Microsoft Downloads site but is not supported by CSS. One of the tasks that can be performed by this utility is to connect to User Instances. The SSEUtil.exe –childlist command will list all the RANU instances on the machine. The output is the same as the one shown above which was retrieved using sys.dm_os_child_instances. Refer screenshot below.

    image

    The ReadMe.htm available with the installation of the utility has information on what can be done with this utility other than connecting to a user instance.

    You can then connect to the instance using the following command:

    SSEUtil.exe -c –child <domain>\<user name>

    How do I shutdown a RANU/User Instance?

    A RANU instance has a defined timeout value of 60 minutes; after 60 minutes without activity, RANU shuts itself down. The RANU timeout is configurable at the parent instances through the ‘User Instance Timeout’ setting. If you want to shutdown a RANU instance before the timeout is reached, then you can use one of the methods listed above to connect to the User Instance and issue the following command:

    SHUTDOWN WITH NOWAIT

    References:
    Understanding SQL Express behavior: Idle time resource usage, AUTO_CLOSE and User Instances
    Connecting to SQL Express User Instances in Management Studio

    Now it’s time to shutdown this post… Adieu till the next post.

  • Tools Tips and Tricks #1: Process Monitor

    I recently wrote about importing a Process Monitor trace into SQL Server database table and crunch up the data to extract the events and call stacks. This prompted me to think about capturing data with Process Monitor and some things I learnt along way while using this tool working at CSS.

    imageThe first tip is to disable any activity that you don’t want to capture or are not required for the issue that you are troubleshooting. The capture tracks three classes of operations: File System, Registry and Process. In the toolbar show on the left in the screenshot, you can enable/disable the following captures:

    a. Registry activity
    b. File System activity
    c. Network activity
    d. Process and Thread activity
    e. Profiling events

    More information about the above is available in the Process Monitor help file. image

    The command line options specified are immensely helpful if you are scripting the capture of a trace using a batch file or if you are generating an automation routine to load the captured data into another data source. I had used /OpenLog and /SaveAs1 option to generate the XML file from the saved .PML file.

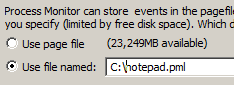
    imageOne of the most useful options that I suggest using when capturing a Process Monitor trace is to use the backing file option (/BackingFile command line parameter or CTRL+B when using the GUI). This prevents using the page file as the backing store for trace capture and avoid running in unresponsive server issues while you are still capturing your trace and the paging file fills up. I normally point the backing file to a local drive on the machine which has sufficient amount of disk space.image

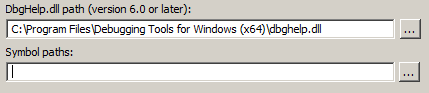
    Process Monitor can use symbol information, if available, to show functions referenced on event stacks. You can point to the symbol path (local symbol cache or Microsoft Symbol Server: http://msdl.microsoft.com/download/symbols) using Options –> Configure Symbols. Additionally, you can specify the path to the source files for the application in the same dialog. This will help you resolve the function calls using the symbol path and if a source path is present, open a text viewer dialog with the source line highlighted which is being referenced. The symbol path is needed when /SaveAs2 option is used for converting the .PML file to .XML format. Note that this option considerably increases the export time due to symbol resolution time involved.

    I am starting a series tagged with “Tools Tips and Tricks” which will document the various tweaks that I use for data collection for the various data collection/analysis tools that I use on a day-to-day basic.

  • T-SQL Tuesday #18: CTEs, XML and Process Monitor

    T-SQL TuesdayThis month’s recurring SQL blog party a.k.a. T-SQL Tuesday started by Adam Machanic (blog | @AdamMachanic) is being hosted by Bob Pusateri (blog | @SQLBob). This month’s topic is about Common Table Expressions which was introduced for the first time in SQL Server 2005. CTEs can be thought of as a derived table which can be self-referenced within a query. With the advent of CTEs, a lot of T-SQL developers made full use of this feature. Personally, I have used CTEs for various data collection and parsing scripts that I use for daily for my day-to-day work. I am a big fan of CTEs and have introduced their usage in one of the blocking reports for SQL Nexus. As with any coding construct, the use of CTEs has it’s PROs and CONs but in this post, I shall not go down the path as there are a lot of depends on whether a particular scenario is fit for the use of CTE of a temporary table. That decision has to be made based on testing against the benchmarks that you have or response-time SLAs that have defined for your application.

    Since my primary expertise lies with SQL Server, I examine every opportunity of data analysis with the intention of importing the data into a SQL Server database table and then writing an automation routine over it to help me save the repititive iterations when I am analyzing the same data or need to perform the same set of steps over and over again. Recently I have shifted over to Powershell due to affinity for scripting but that will be a story for some other blog post. CSS uses Process Monitor, a vastly popular tool from Sysinternals, to troubleshoot various problems that we encounter while working on SQL Server related issues. Some of our adventures with Process Monitor are mentioned below:

    PRB: SQL Backups to a UNC path fail with OS Error 1 (Incorrect Function)
    INF: Permissions required for SQL Server Service account to use SSL certificate

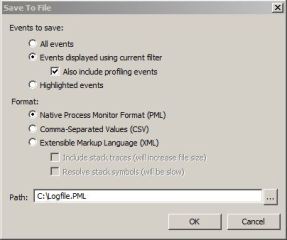
    During my tenure here with CSS, I too have relied on the Process Monitor to troubleshoot some fairly complex issues. Sometimes the Process Monitor .pml files can be quite large if collected without adding appropriate filters and I am just interested in a particular process(es). By importing the .PML file into a database, I can not only query the imported data using T-SQL queries but I can also write quick automations to look for common stack traces that I know have known issues/problems associated with them. Yes with Process Monitor, you can use locally cached symbols to get the call stack of the function call as well. Note that saving a .PML into XML with resolved stack symbols is slow due to the time taken for symbol resolution. The .XML file that I will use as an example was saved using the “Extensible Markup Language (XML)” option with “Include stack traces (will increase file size)” option enabled. I captured a Process Monitor trace while trying to access a directory which was not present on my server.

    I already have a stored procedure to import the saved .XML file into a database table, then parse that existing data and insert the parsed data into the two tables that I have created to stored the event and stack information.

    How does the use of CTEs fit in here?

    The .XML file has the following structure for the stack and the frames:

    <ProcessIndex>2083</ProcessIndex>
    <Time_of_Day>5:52:38.8471548 PM</Time_of_Day>
    <Process_Name>Explorer.EXE</Process_Name>
    <PID>6588</PID>
    <Operation>NotifyChangeDirectory</Operation>
    <Path>D:\Tools</Path>
    <Result></Result>
    <Detail>Filter: FILE_NOTIFY_CHANGE_FILE_NAME, FILE_NOTIFY_CHANGE_ATTRIBUTES, FILE_NOTIFY_CHANGE_LAST_WRITE</Detail>
    <stack>
    <frame>
    <depth>0</depth>
    <address>0xfffff880013ab027</address>
    <path>C:\Windows\system32\drivers\fltmgr.sys</path>
    <location>fltmgr.sys + 0x2027</location>
    </frame>

    <frame>
    <depth>1</depth>
    <address>0xfffff880013abbe9</address>
    <path>C:\Windows\system32\drivers\fltmgr.sys</path>
    <location>fltmgr.sys + 0x2be9</location>
    </frame>
    ….
    ….
    </stack>

    Now each operation has a call-stack associated with it which I am interested in importing into my database. But with the existing schema above, I cannot get the information that I require . After exploring the use of multiple ways of parsing the data using temporary variables, temporary tables, recursive CTEs, XML indexes and blah.. blah.. , I found that that quickest way to do this was:

    1. Get the event list imported into a temporary table
    2. Using the event list generated above, create the call stacks from the <frame> nodes (see code snippet below)

    The logic here is that the cteXML used below extracts all frames for a particular event using a counter variable and creates XML data for each of the frames which are parsed by referencing the cteXML in the INSERT INTO…SELECT query.

    -- Extract events from the XML file and put them into a staging table
    
    INSERT INTO #tblXMLstaging (event,fname)
    
    SELECT C.query('.') as event,@fname
    
    FROM dbo.tbl_XMLData
    
    CROSS APPLY xmldata.nodes('/procmon/eventlist/event') as T(C)
    
    WHERE fname = @fname
    
    -- Fetch values from staging table, store parsed frames in an XML and parse them to insert data into procmon_stacks table
    
    WITH ctexml as
    
    (
    
    SELECT TOP 15 eventid,C.query('.') as frames,fname
    
    FROM #tblXMLstaging
    
    CROSS APPLY event.nodes('/event/stack/frame') as T(C)
    
    WHERE eventid = @counter
    
    )
    
    INSERT INTO dbo.tblProcMon_Stacks (StackID, FName, FrameDepth, [Address], [Path], Location)
    
    SELECT
    
    eventid as StackID,
    
    fname,
    
    frames.value ('(/frame/depth)[1]', 'int') as FrameDepth,
    
    frames.value ('(/frame/address)[1]', 'varchar(50)') as [address],
    
    frames.value ('(/frame/path)[1]', 'varchar(255)') as [Path],
    
    frames.value ('(/frame/location)[1]', 'varchar(255)') as [location]
    
    FROM ctexml

    The output of

    If you are curious as to how long it takes to import the data, it took me a little over a minute (84 seconds to be precise) to load a 100MB XML file, parse and shred it! I am sure that there are optimizations possible to this method. The screenshot on the left shows the load times. The system specifications on where the data import is being done is: 

    Operating System: Microsoft Windows Server 2008 R2 Enterprise (x64)

    Machine: Hewlett-Packard HP Z800 Workstation

    Processor: 2 Quad Core [Intel(R) Xeon(R) CPU E5506  @ 2.13GHz, 2128 Mhz, 4 Core(s), 4 Logical Processor(s)]

    RAM: 16.0 GB

    Hard Disk: Barracuda 7200.12 SATA 3Gb/s 500GB Hard Drive

    SQL Server: SQL Server 2008 R2
    Now that the data is available in a database table, I can query the information using T-SQL queries. I had attempted to open the directory C:\Foo on my server using Windows Explorer. This information and the callstack can be visible using the following T-SQL queries:

    -- Get the event information associated with the directory that I was looking up
    select ProcessName, PID, Operation, Path, Result, Detail, StackID from dbo.tblprocmon_events
    
    where fname = 'FileNotFound.xml'
    
    and path like '%C:\Foo%'
    
    order by StackID
    
    -- Get information for the call-stack using the StackID obtained above
    select FrameDepth, address, Path, Location
    
    from tblProcmon_stacks
    
    where fname = 'FileNotFound.xml' and StackID = 662
    
    order by FrameDepth


    Below is a screenshot showing me that the directory doesn’t exist and the call-stack associated with the function call that failed.

    The options are now limitless, you can take this forward by creation for common callstacks in-case you are troubleshooting an application developed by you and have access to the private symbols. Or you could look for common results for certain operations like Operation = QueryDirectory and Result = NO SUCH FILE. My use of CTEs are for the following tasks:

    1. Parsing XML data as shown here
    2. Extracting useful information from Ring Buffers
    3. Tracking available contiguous memory used and available in the SQL Server process address space

    The scripts containing the Stored Procedure definitions and table schemas can be downloaded from here.

  • SQL Nexus: What StartTimeInterval?

    When I get asked the same question more than 3 times in less than 48 hours, I guess it’s time to create some documentation around the error.

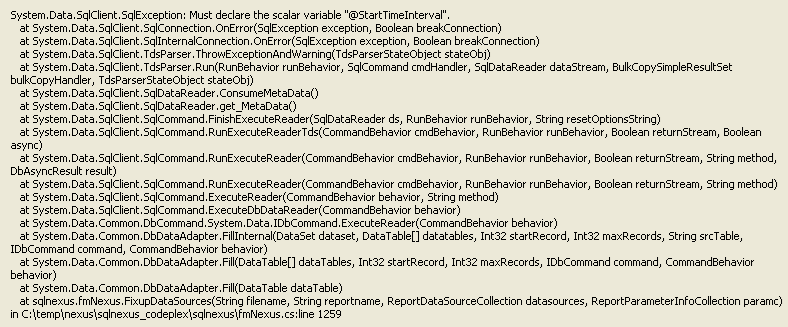
    The issue is when you click on the UniqueStatements link in the ReadTrace_Main report in SQL Nexus, you get the following exception:

    image

    If you collect a profiler trace, you will find that the error is raised while executing the following command:

    exec ReadTrace.spReporter_StmtTopN @StartTimeInterval, @EndTimeInterval, @TopN, @Filter1, @Filter2, @Filter3, @Filter4, @Filter1Name, @Filter2Name, @Filter3Name, @Filter4Name

    The error message would be:

    Error: 137, Severity: 15, State: 2
    Must declare the scalar variable "@StartTimeInterval".

    The above error will be reported in the exception message that is raised in SQL Nexus as well. The issue is not with SQL Nexus but with the RML Utilities report. You can get this issue under the following condition:

    1. There are no entries in the readtrace.tblStatements and readtrace.tblTimeIntervals tables.
    2. Or if you are using an older version of ReadTrace (RML Utilities)

    I was able to reproduce the issue on ReadTrace.exe build of 9.01.0109.

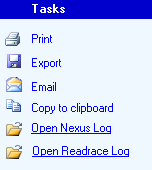
    The issue stems from the fact that when you click on the UniqueStatements report link and no parameters are specified, thimagee Start Time and the End Time to be analyzed is picked up from the tblTimeIntervals. I was able to reproduce the issue on the same SQL Nexus database using one version of ReadTrace reports and not with the other. You can send an email to sstlbugs@microsoft.com and request the latest build for RML Utilities with the ReadTrace and SQL Nexus log file as attachments. The logs can be retrieved by clicking on the hyperlinks in SQL Nexus shown in the picture on the right.

    del.icio.us Tags: ,,