Category: Tech

Posts about tools, browsers, product tech, and general technology beyond pure data platforms.

  • Deadlocked Schedulers and event notifications with a bit of Powershell

    I had written 2 posts recently about Deadlocked Schedulers debugging (Part 1 | Part 2) which basically walked through a 17784 and 17888 condition and the steps that you could take to debug such an issue. A quote from the both these articles:

    So if you have a monitoring tool that is capturing the output of queries being executed by the active SQL Server sessions, then you can go back to your monitoring repository and dig up the queries which these threads were executing. If such data is not available from the time of the issue, more often that not you will have to end up collecting additional data for the next problem occurrence!

    You will need to collect additional data if there wasn’t a monitoring software collecting the same to determine the set of queries and sequence of events leading upto the issue. CSS Engineers can dig into the dump using the private symbols and probably provide you with additional information which can help you along the right direction. But alas, even they do not have magic wands if you cannot provide them with additional information like blocking output/profiler traces for 17884 and 17888 conditions caused by excessive blocking or parallelism.

    SQL Server 2008 Service Pack 2 provided an update which made the FailoverAnalysis.sql script available again. This was available in SQL Server 2005 and now is available for SQL Server 2008 as well. This is particularly useful for SQL Server Failover Clusters where you can configure SQLDumper to generate a dump before the failover occurs and also set the SqlDMVScriptTimeout property to get an output of the DMVs used in the script before a failover happens.

    image

    You can refer “Cluster failovers and the Sqldumper.exe utility” section in the KB917825 for more details on the above mentioned feature. So what am I doing writing this post??

    This post is aimed at SQL Server Standalone instances where you cannot benefit from sqldumper. Deadlocked Schedulers are reported with EventIDs 17884 or 17888. I am going to use this to create an scheduled task on a Event Log entry for these two specific EventIDs. I am big fan of automating repetitive tasks and the benefit of such an automation is that you can get additional data from the problem occurrence without having to just rely on a SQL Server mini-dump memory file and be at the mercy of the Windows Debugging tools. For this post, you can say a small good-bye to your favorite debugging tool and read on for some automation in monitoring!!

    However, there are some requirements for this kind of indigenous monitoring to work:

    1. Dedicated Administrator Connection needs to be enabled for your SQL Server instance(s) – This is required because during a Deadlocked Schedulers condition, you would have run out of worker threads. So, new connection requests cannot be processed unless and until you establish a connection through DAC. If you are planning to use Event Subscription and remote data gathering, then you need Remote DAC enabled for your SQL instance(s) being monitored. Note: Event subscription is a feature available on Windows Server 2008 and above.

    2. You need sysadmin privileges for the account that will be used to collect the output of the FailoverAnalysis.sql script.

    3. Powershell and SQLPS needs to be available on the server being monitored. If you don’t want to install Powershell components, then the same functionality can be achieved using SMO and VBScript which I have used extensively in the past till I became a fan of POSH awesomeness!! Smile

    Now that I have the pre-requisites out of the way, let’s get down to the good part…

    The Powershell Script

    I had already mentioned that I will be using a Powershell script to get the output of the FailoverAnalysis.sql script for the SQL instance that is encountering the 17884 condition. The piping feature of Powershell really makes it easy to write compact scripts to perform a wide variety of tasks. The script is divided into three parts.

    The first part of the script actually uses the script in the section “Adding the SQL Server Snap-ins to Windows PowerShell” of the article “Running SQL Server PowerShell” to initialize the SQLPS snap-in in the session that you will be running the script.

    The second part of the script reads the Application event log for the first occurrence of an informational message with the text substring “have not been picked up by a worker thread in the last 60 seconds” from any SQL Server instance as the source.

    The third part of the script figures out the SQL Server instance name and connects to it to execute the FailoverAnalysis.sql script. You can modify the output location of the script output below as appropriate for your environment.

    Script filename: DeadlockSchedulerMonitor.ps1

    
    #################################################################################
    
    # Script Name: DeadlockSchedulerMonitor #
    
    # Author: Amit Banerjee #
    
    # Date: 9/1/2011 #
    
    # Description: #
    
    # The script reads the first 17884 (Deadlocked Schedulers) event from the #
    
    # Windows Application Event log and identifies the source. Based on the #
    
    # source name, it connects to the SQL Server instance using a DAC #
    
    # connection and collects the FailoverAnalysis.sql script output. #
    
    #################################################################################
    
    $vMsg = (Get-Date).Year.ToString() + (Get-Date).Month.ToString() + (Get-Date).Day.ToString() + (Get-Date).Hour.ToString() + (Get-Date).Minute.ToString() + ":Performing SQLPS snap-in initialization`n"
    
    Write-Host $vMsg
    
    # Call the initialization script to load the SQLPS snap-in in the session that you running your script
    
    # Add the SQL Server Provider.
    
    $ErrorActionPreference = "Stop"
    
    $sqlpsreg="HKLM:\SOFTWARE\Microsoft\PowerShell\1\ShellIds\Microsoft.SqlServer.Management.PowerShell.sqlps"
    
    if (Get-ChildItem $sqlpsreg -ErrorAction "SilentlyContinue")
    
    {
    
    Write-Host "SQL Server Provider for Windows PowerShell is not installed.`n"
    
    }
    
    else
    
    {
    
    $item = Get-ItemProperty $sqlpsreg
    
    $sqlpsPath = [System.IO.Path]::GetDirectoryName($item.Path)
    
    }
    
    # Set mandatory variables for the SQL Server provider
    
    Set-Variable -scope Global -name SqlServerMaximumChildItems -Value 0
    
    Set-Variable -scope Global -name SqlServerConnectionTimeout -Value 30
    
    Set-Variable -scope Global -name SqlServerIncludeSystemObjects -Value $false
    
    Set-Variable -scope Global -name SqlServerMaximumTabCompletion -Value 1000
    
    # Load the snapins, type data, format data
    
    Push-Location
    
    cd $sqlpsPath
    
    Add-PSSnapin SqlServerCmdletSnapin100 -ErrorAction SilentlyContinue
    
    Add-PSSnapin SqlServerProviderSnapin100 -ErrorAction SilentlyContinue
    
    Update-TypeData -PrependPath SQLProvider.Types.ps1xml -ErrorAction SilentlyContinue
    
    update-FormatData -prependpath SQLProvider.Format.ps1xml -ErrorAction SilentlyContinue
    
    Pop-Location
    
    $vMsg = (Get-Date).Year.ToString() + (Get-Date).Month.ToString() + (Get-Date).Day.ToString() + (Get-Date).Hour.ToString() + (Get-Date).Minute.ToString() + ":SQLPS snap-in initialization completed`n"
    
    Write-Host $vMsg
    
    # Local variables to store the event log source and the instance name to which the DAC connection needs to be made
    
    [string] $vSource
    
    [string] $vInstName
    
    [string] $vFileName
    
    $vMsg = (Get-Date).Year.ToString() + (Get-Date).Month.ToString() + (Get-Date).Day.ToString() + (Get-Date).Hour.ToString() + (Get-Date).Minute.ToString() + ":Reading Application Event Log`n"
    
    Write-Host $vMsg
    
    # Get the source which generated the 17884 message
    
    $vSource = Get-EventLog -LogName "Application" -Message "*have not been picked up by a worker thread in the last 60 seconds*" -Source MSSQL* -Newest 1
    
    $vSource = $vSource.Source.ToString()
    
    $vMsg = (Get-Date).Year.ToString() + (Get-Date).Month.ToString() + (Get-Date).Day.ToString() + (Get-Date).Hour.ToString() + (Get-Date).Minute.ToString() + ":Connecting to SQL instance and executing script`n"
    
    Write-Host $vMsg
    
    # Check if it is a default instance or named instance and accordingly collect the output
    
    if ($vSource.Equals("MSSQLSERVER"))
    
    {
    
    # Create the filename
    
    $vFileName = "F:\" + (Get-Date).Year.ToString() + (Get-Date).Month.ToString() + (Get-Date).Day.ToString() + (Get-Date).Hour.ToString() + (Get-Date).Minute.ToString() + (Get-Date).Second.ToString() + "_" + $env:ComputerName.ToString() + "_FailoverAnalysis.OUT"
    
    # Use Invoke-Sqlcmd to get the output of the script
    
    Invoke-Sqlcmd -InputFile "C:\Program Files\Microsoft SQL Server\MSSQL.1\MSSQL\Install\FailoverAnalysis.sql" -ServerInstance $env:ComputerName -DedicatedAdministratorConnection | Out-File -filepath $vFileName
    
    }
    
    else
    
    {
    
    # Construct the SQL Server name to connect to for a named instance
    
    $vInstName = $env:ComputerName + "\" + $vSource.Split("$")[-1]
    
    # Create the filename
    
    $vFileName = "F:\" + (Get-Date).Year.ToString() + (Get-Date).Month.ToString() + (Get-Date).Day.ToString() + (Get-Date).Hour.ToString() + (Get-Date).Minute.ToString() + (Get-Date).Second.ToString() + "_" + $vInstName + "_FailoverAnalysis.OUT"
    
    # Use Invoke-Sqlcmd to get the output of the script
    
    Invoke-Sqlcmd -InputFile "C:\Program Files\Microsoft SQL Server\MSSQL.1\MSSQL\Install\FailoverAnalysis.sql" -ServerInstance $vInstName -DedicatedAdministratorConnection | Out-File -filepath $vFileName
    
    }
    
    $vMsg = (Get-Date).Year.ToString() + (Get-Date).Month.ToString() + (Get-Date).Day.ToString() + (Get-Date).Hour.ToString() + (Get-Date).Minute.ToString() + ":Script execution completed`n"
    
    Write-Host $vMsg


    The Task Scheduler Configuration

    The next thing that is needed to be done is create Task Scheduler task to execute the Powershell script above when a 17884 condition is reported.

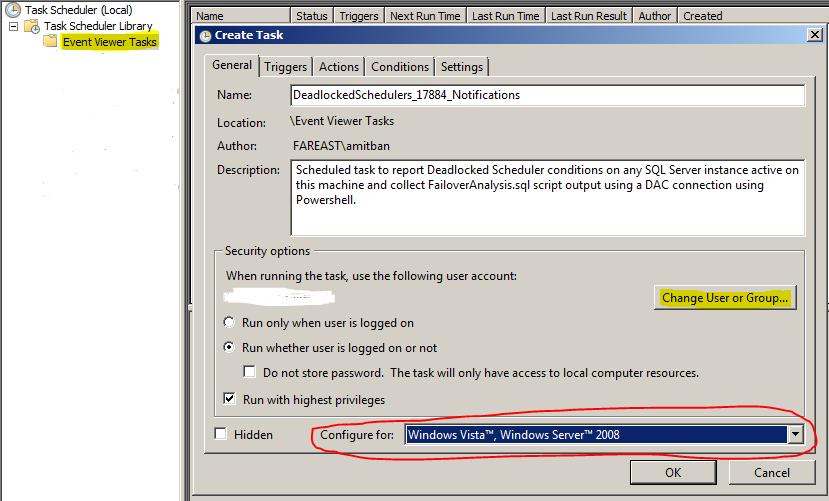
    1. Open the Task Scheduler MMC using Start –> Administrative Tools –> Task Scheduler to get the Task Scheduler UI. Right click on Event Viewer Tasks and click on Create Task (see screenshot below). Provide the appropriate settings, description and name. The salient points to keep in mind here are:
    a. Use the Change User or Group option to provide an account which has permissions to log into the SQL Server instance(s) to gather the output of the FailoverAnalysis.sql script.
    b. You can use the Configure for drop-down box to configure the task for Windows Server 2003 as well.image
    2. Next click on the Triggers tab. Click on New, which will open the New Trigger dialog box. Use the Begin the Task drop down box to select On an event option (see screenshot below). Then select the Custom radio button and click on New Event Filter button which will open the New Event Filter dialog box. Provide the options as shown by the highlighted items in the screenshot. In the event sources drop down list, I selected all the SQL Server instances installed on my server. You can choose to leave the default option in case you plan to install more instances on this server. Using the default option can be beneficial if you choose to export this task to other servers as well. Provide the Advanced Settings option in the New Trigger dialog box. I chose to Stop task if it runs more than 30 minutes. Once that is done, you should see new trigger entry in the Trigger tab as On an Event with a custom event filter and the status as enabled.image
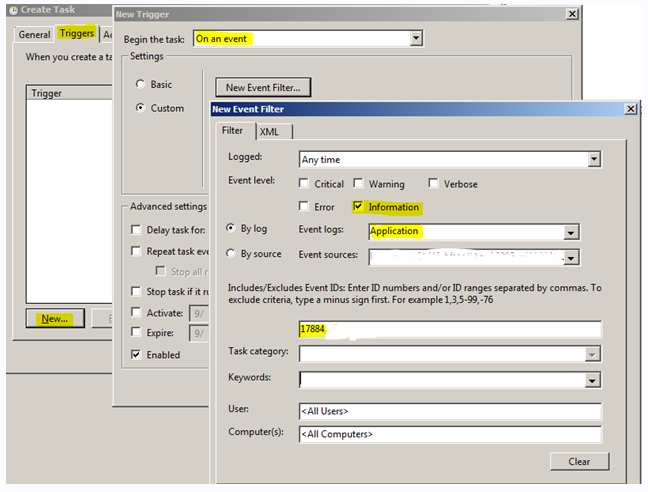
    3. Under the Actions tab, click on New. Select Start a Program from the Action drop-down box. In the Program/script text box, provide Powershell.exe. In the Add arguments (optional) text box, provide the following: -File “F:\DeadlockSchedulerMonitor.ps1”. Or you can choose to provide a .cmd file path whose contents are “Powershell.exe -File “F:\DeadlockSchedulerMonitor.ps1” > F:\DeadlockSchedulerMonitorLog.txt”. I went with the second option. F: drive root is where my .ps1 script and .cmd file are present. You would need to modify this accordingly depending on where your script is. Once that is done, your action tab should be similar to the screenshot below.

    image

    4. I used the default settings for the Conditions and Settings tab. You can modify this as appropriate for your environment.

    Once the task is created, all you need is for a 17884 condition to occur for the script output to be generated.

    Let’s see the configuration in action

    image

    I simulated a 17884 condition on my SQL Server instance, see if the newly created task gets fired. (see above Application Log snippet). Looking into the F: drive, I find that the following files were created

    20119212197_<sql instance name>_FailoverAnalysis.OUT
    201192121918_<sql instance name>_FailoverAnalysis.OUT

    The reason I have two files is that this is a two NUMA node box, and the deadlock schedulers condition was reported for both nodes. Note that this script reports first occurrence which is reported at 60 seconds since the message text snippet that is used to fetch the event from the Application log specifically looks for the 60 seconds keyword.

    NOTE: You can monitor for 17888 events using the following message text instead of the one used above in the script for 17884 script and create a new task for the same. Message text: *appear deadlocked due to a large number of worker threads waiting*

    What next?

    Well with automation the possibilities are endless… Some of the quick things that come to my mind are:

    1. You can create an event subscription and use the Forwarded Events log to track all 17884 from different servers which have SQL Server instances installed on them.
    2. You can modify the powershell script to perform additional post processing or send out email notifications to your DBAs for the occurrence of such events.
    3. You could even add additional post processing to the Powershell script to perform additional tasks.

    If you have SCOM or any other Event log monitoring software, the only thing that you need to do is setup a custom alert for 17884 or 17888 error messages.

    Have fun monitoring and customizing further!

    Reference:

    Understanding and Using PowerShell Support in SQL Server 2008
    Windows Server 2008 Event Subscription with Task Scheduling

    Disclaimer: This script and the solution provided is “AS IS” and any deployment that you do using a similar logic described requires due-diligence and testing on your part. The testing that I did for this was on Windows Server 2008 R2 & SQL Server 2008 R2.

  • SQL Server Backup Simulator v2 available now

    SQL Server Backup Simulator is used by CSS to troubleshoot SQLVDI related issues and to identify if the SQLVDI DLL is functioning correctly. Based on the feedback received from the use of the tool and the current troubleshooting needs, we decided to do v2 release for SQL Server Backup Simulator.

    The new features for the v2 release are:

    1. Log backup – Now the tool can perform log backups. The tool performs COPY_ONLY backups so that your LSN chain is not broken.
    2. Compression support – Starting from v2, the tool will allow you to take backups with compression enabled for SQL Server 2008 and higher.

    The compression option drop-down list has three-options:
    a. With Compression: This option will allow you to perform a backup with compression enabled even if the server default is not to use compression for backups.
    b. No Compression: This option will allow you to perform a backup with compression disabled even if the server default is to use compression for backups.
    c. Server Default: This option uses the server default setting (configuration setting: backup compression default) to perform the backup.

    image

    Screenshot of the v2 UI

    Log Restore option is not currently available in this release. The incorporation of this feature will be evaluated while planning for the next release.

    A big thank you to Sakthi [Blog | Twitter] for his assistance on the v2 release.

    The latest release can be downloaded here.

    Previous posts for Backup Simulator:
    SQL Server Backup Simulator v1.0
    http://blogs.msdn.com/b/sqlserverfaq/archive/2010/10/27/sql-server-backup-simulator.aspx
    SQL Server Backup Simulator v1.2
    https://troubleshootingsql.com/2011/01/17/sql-server-backup-simulator-cumulative-update/

  • Tools Tips and Tricks #12: XPerf, Memory usage and much more

    This is the last post for the series Tools Tips and Tricks as May draws to a close. Today I shall talk about another tool that we use called XPerf for performance troubleshooting. Though this is not a common tool which is used on a regular basis by the SQL CSS team. But when we do decide to use this for very specific scenarios, the usefulness of this tool cannot be put in words. I had talked about using Debug Diag for monitoring memory usage and tracking down allocations right upto the function call. There is another way to track heap allocations which is what I shall be talking about today. I shall use the same MemAllocApp that I had used last week. I start off the Xperf monitoring using the following commands:

    xperf -on PROC_THREAD+LOADER -BufferSize 1024 -MinBuffers 16 -MaxBuffers 16
    xperf -start HeapSession -heap -Pids 9532 -BufferSize 1024 -MinBuffers 128 -MaxBuffers 128 -stackwalk HeapAlloc+HeapRealloc+HeapCreate

    Now once I have collected the XPerf data, you can use the following command to stop the data collection:

    xperf -stop HeapSession -stop –d F:\MemAlloc.etl

    Once that is done, you should have an ETL file in the specified location by the –d parameter. Since, I am interested in the functions in the functions which were allocating the maximum amount of memory, I will use the following command to generate a summary report for the heap allocations traced by XPerf using the command below:

    xperf -i "F:\MemAlloc.etl" -o "F:\MemAlloc.txt" -symbols -a heap -stacks -top 5

    /* Output of MemAlloc.txt file */

    Results for process MemAllocApp.exe (9532):

    ———————————————————————

    GLOBAL ALLOCATIONS:
    Alloc       :         100,     512000.0 KB
    Realloc     :           0
    Outstanding :         100,     512000.0 KB

    ———————————————————————

    TOP 1:
    Alloc       :         100,     512000.0 KB
    Realloc     :           0
    Outstanding :         100,     512000.0 KB

    ———————————————————————

    MemAllocApp.exe!fn_allocatememory
    MemAllocApp.exe!wmain
    MemAllocApp.exe!__tmainCRTStartup
    MemAllocApp.exe!wmainCRTStartup
    kernel32.dll!BaseThreadInitThunk
    ntdll.dll!RtlUserThreadStart

    Alloc       :         100,     512000.0 KB
    Realloc     :           0
    Outstanding :         100,     512000.0 KB


    As you can see from the above output, the function fn_allocatememory was responsible for 100 allocations worth 512KB each. With just the use of a single command I was able to figure out the reason behind my outstanding allocations for my EXE. Troubleshooting SQL Server outstanding memory allocations for heaps may not be as easy as this but it definitely saves time in having to look and dig out the allocations from the a memory dump.

    This method is quite useful when you have a very large ETL file which you need to analyze. You can even configure a Circular Buffer for capturing data appending the following command for your HeapSession tracing commands:

    -BufferSize 1024 -MaxBuffers 1024 -MaxFile 1024 -FileMode Circular

    Note: Make sure that you set your _NT_SYMBOL_PATH environment variable correctly if you want the function calls to be resolved correctly.

    Hope you enjoyed this series of Tools Tips and Tricks as much as I had fun in posting the various methods that I use to collect diagnostic data while troubleshooting SQL performance related issues.

    References:
    Using Actions to process Heap Data
    Enabling Data Capture using XPerf
    XPerf Options

  • Tools Tips and Tricks #11: Debug Diag and Memory leaks

    This week I had shown how to use Debug Diagnostic tool to capture a dump for a first chance exception encountered by an application and perform analysis using the Crash Analysis rule. Today I am going to show to use Debug Diagnostic tool to track outstanding memory allocations for a process.

    Steps

    image1. Launch the Debug Diagnostic tool and click on the Rules tab. Click on Add Rule.

    2. Select the Native (non-.NET) Memory and Handle Leak rule. (see screenshot on the right)

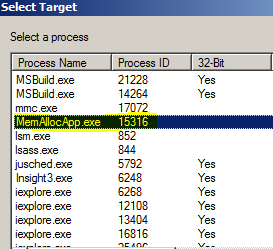
    3. You cannot setup a memory leak tracking rule for a process that is not running as the Leak Tracking dll has to hook onto the imageprocess. In this example, I will be using the tool to track an executable called MemAllocApp.exe. Select the required process using the Select Target window. (see screenshot on the left)

    4. In the next window titled “Configure Leak Rule”, you can use that to go granular with your tracking requirements. I have opted not to generate a dump after n minutes of tracking (Option: Generate final userdump after x minutes of tracking). I have selected an auto-unload of the Leak Tracking DLL once the rule is completed or deactivated (Option: Auto-unload Leak Track when rule is completed or deactivated). (see screenshot below)

    5. Click on the Configure button and you can then configured additional options for the userdump generation for the process being tracked. I also have the tool set to automatically capture a user dump if the process that I am tracking unexpectedly shuts down. (Configure userdumps for Leak Rule window below in screenshot). I have configured the rule to capture a dump automatically if the process unexpectedly shuts down. (Option: Auto-create a crash rule to get userdump on unexpected process exit). Additionally, I have configured the rule to capture a userdump once the private bytes for the process reaches 350MB. (Option: Generate a userdump when private bytes reach x MB). As you can see in the screenshot below, there are additional options that you can configure but I don’t need them for this particular demo. image

    6. Next you get the “Select Dump Location and Rule Name” window where you can changed the rule name and the location of the dumps generation. By default the dumps are generated at <Debug Diagnostic Install Path>\Logs\<Rule Name> folder.

    7. Click on Activate Rule in the next window to start the tracking.image

    Note: If you are not in the same session as the Debug Diag Service, then you will get the following message when you get the following pop-up, once you have configured the rule. Click on Yes. And then you should get a pop-up stating that Debug Diag is monitoring the EXE for leaks.

    Process MemAllocApp.exe(15316) is in the same logon session as DebugDiag (session 2), but it is not in the same logon session as the DbgSvc service (session 0).  Do you want to return to ‘Offline Mode’ and continue?

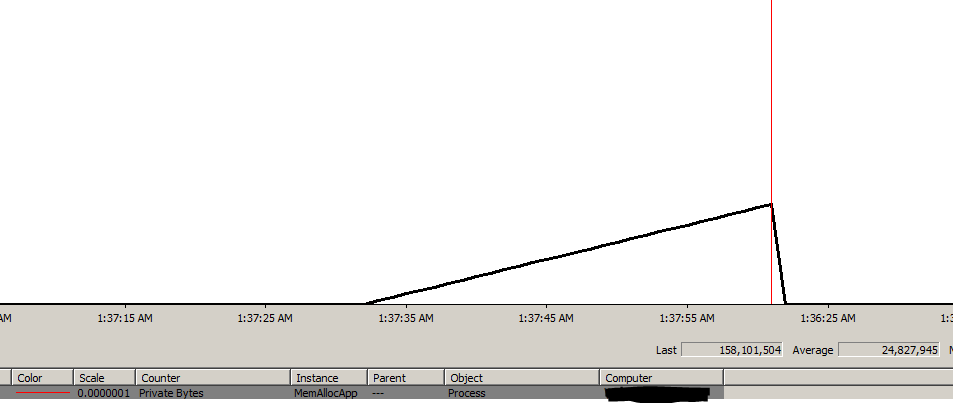
    On the Rules tab, you should see two rules. One for the leak tracking and the other for the crash rule. Once I hit the threshold of 350MB of privates bytes, I will a dump generated and the Userdump Count column value should change to 1. I was monitoring my application’s Private Bytes perfmon counter and the graph showed a steady increase. (see screenshot below). Now that the rule is active, I can find that the Being Debugged column has the value “Yes” and the LeakTrack Status column value will be Tracking for MemAllocApp.exe under the Processes tabs.image I then used the Analyze Data button under the Rules tab to generate the memory tracking report of a memory dump that I had captured earlier which I analyzed and these are a few excerpts from the report. image

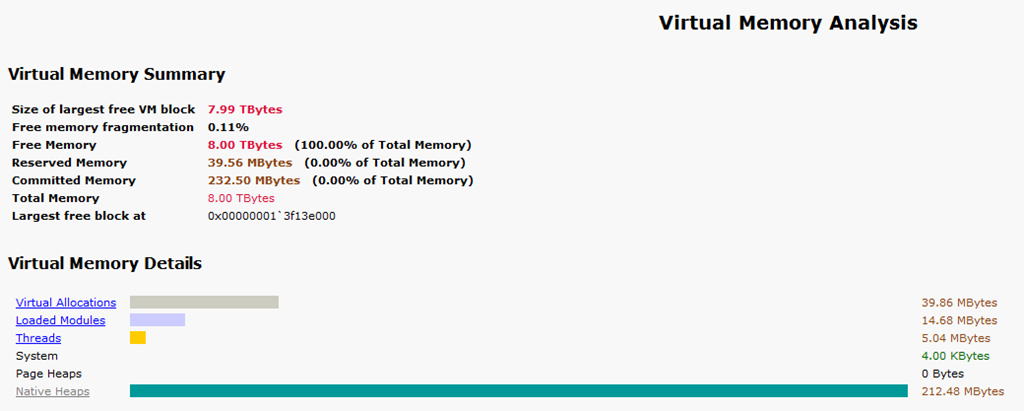
    The Analysis Summary tells me that I have outstanding memory allocations of 205MB. This dump was generated using a rule to capture a userdump when Private Bytes for the process exceeded 200MB. Next I shall look at the Virtual Memory Analysis Summary sub-heading…

    image

    This clearly tells me that the memory allocations are coming from the Native Heaps. And I know from the previous screen-shot that Heap Allocation functions (HeapAlloc) is being called. Now digging into the Outstanding Allocation Summary, I find that over 200MB of allocations have been done from my application and all allocations have been done on the heap. In the Heap Analysis summary, I find that the allocations have all come in from the default process heap. Drilling down into the MemAllocApp hyperlink, I get the offset making these allocations which is MemAllocApp+2cbb. image

    The function details from the report is available in the quoted text below. If I have the debug symbols of the application (which I do), I find that this corresponds to my function call fn_allocatememory which makes 5MB allocations using HeapAlloc on the default process heap. If you align your symbols correctly for the analysis, you will find that the report also gives you the correct function names.

    Function details

    Function
    MemAllocApp+2cbb

    Allocation type
    Heap allocation(s)

    Heap handle
    0x00000000`00000000

    Allocation Count
    41 allocation(s)

    Allocation Size
    205.00 MBytes

    Leak Probability
    52%

    So without any debugging commands, I was able to drill down to the culprit making the maximum number of allocations. This can be quite a useful way of tracking down non-BPool (commonly known as MemToLeave on 32-bit SQL instances) allocations when the Mutli Page Allocations don’t show a high count but you are experiencing non-BPool memory pressure.

    The fn_allocationmemory function code is mentioned below:

    void fn_allocatememory(int cntr)
    {
    printf("Sleeping for 10 seconds\n");
    Sleep(10000);
    BYTE* pByte=(BYTE*) HeapAlloc(GetProcessHeap(), 0, 5242880);
    (*pByte)=10;
    printf("Iteration %d: Allocating 5MB using HeapAlloc\n",cntr+1);
    }

    I used the same HeapAlloc function that Sudarshan had used in his latest blog post to explain behavior changes in Windows Server 2008 for tracking heap corruptions.

  • Tools Tips and Tricks #10: Caching PDB files locally

    When you are debugging a SQL Server memory dump, you would need the PDB files associated with the sqlservr.exe that you are debugging to get the call stacks. The PDB files can be downloaded from the Microsoft Symbol Server. Paul Randal [Blog | Twitter] in a previous blog post showed how to do this using symchk.exe. If you want to download symbols for multiple EXEs then you either need to create a script file or you could use the method mentioned below provided you have a dump file that you are interested in.

    Today I am going to explain how to download PDB files using CDB (Command Line Debugger) and command script file. The first ingredient for this is a memory dump file (.mdmp or .dmp). Once you have the dump and the Windows Debugging Tools installed on your local machine, you use the following command to cache the symbols to a local folder:

    C:\Program Files\Debugging Tools for Windows (x64)>cdb -y srv*D:\PublicSymbols*http://msdl.microsoft.com/download/symbols -z “D:\SQLDump0134.mdmp” -cfr “D:\ExecuteSymbolFetch.txt” > D:\DebuggingExample.txt

    The –y parameter specifies the local folder into which the symbols need to be cached and the –z parameter is the path to the memory dump file. The –cfr parameter takes the path to the script file which contains the script file to be executed. The contents of my script file are:

    !sym noisy
    .reload /f
    lmvm sqlservr
    qd

    When you look into the DebuggingExample.txt file once the download has completed, you will find the output of the lmvm command which will show you that the PDB file was cached locally:

    0:031> lmvm sqlservr
    sqlservr   (pdb symbols)          d:\publicsymbols\sqlservr.pdb\389EF554D94A4947846D85FCDC4233382\sqlservr.pdb

    Alternatively, you could load the dump using WinDBG and then using the commands from the script file mentioned above to cache the symbols. You would need to set the symbol file path using File->Symbol File Path or CTRL+S option or using the debugger command .sympath. Once that is done, you can executed .reload /f to download the PDB files from the Microsoft Symbol Server. This is helpful when you need symbol files while capturing certain debugging diagnostic data like generating the XML file with the callstacks from a Process Monitor trace as shown here or if you want to perform an analysis using the existing scripts provided with the Debug Diagnostic tool.

    Debugging Download location:
    64-bit Debugging Tools
    32-bit Debugging Tools

    References:
    Using Script files for Windows Debugger
    Command line CDB options

    Tools, Debugging, Tools Tips and Tricks