Previously in the series, we saw three parts:
XML Plans Saga –Twilight – A gist of what graphical execution plans look like.
XML Plans Saga –New Moon – Getting your hands dirty with the actual XML document representing the query plan
XML Plans Saga – Eclipse – Retrieving information about query plans using profiler trace events
In this post, I am going to talk about the use of Dynamic Management Functions to extract the query plans from the cache using sys.dm_exec_query_plan.
- Selecting Display Estimated Execution Plan or Include Actual Execution Plan from the query editor toolbar in SQL Server Management Studio
- Using the Transact-SQL Showplan SET statement options SHOWPLAN_XML (for estimated plan) and STATISTICS XML (actual execution plan)
- Selecting the SQL Server Profiler event classes Showplan XML (for estimated plan), Showplan XML for Query Compile, and Showplan XML Statistics Profile (actual execution plan) for tracing
- Using the sys.dm_exec_query_plan dynamic management function
Now the first thing that you need to keep in mind is that the cached query plans obtained from the procedure cache using the DMV sys.dm_exec_cached_plans are estimated plans. So you will not be able to fetch runtime information from the cached query plan but you can definitely loads of useful information from even the estimated plan as discussed in my earlier posts in the series. But one of the benefits of writing T-SQL queries is that you have the benefit of DMVs and DMFs that you can leverage and without having to shred XML plans, you can view a large amount of statistics regarding these “cached” plans. Since only information about cached plans are maintained by the database engine, you will not be able to view statistics and plans of queries which were executed but their plans were either not cached or have been flushed out of the cache.
So… Let’s begin the fun… This time around, I shall use a stored procedure to demonstrate the benefit of generating plans from the plan cache and shredding them. You could use sys.dm_exec_query_stats to get various runtime statistics for the cached plans in the SQL Server procedure cache. However, the compilation statistics is something that needs to be fetched from the XML plan itself. If you are interested in the SET options, then these are available from the ouptut of the sys.dm_exec_plan_attributes function.
The stored procedure that I am using to retrieve the information from the procedure cache is shown below:
CREATE PROCEDURE usp_searchNumber
@searchNumber int
AS
SELECT TOP 100 chardata
FROM dbo.tblTechEd1
WHERE id < @searchNumber
Now the sys.dm_exec_plan_attributes will provide me with the SET options and other important attributes of the plan like the execution hits, misses and free cache entries. The SET options of the output are reported as an integer value which makes the deciphering of the same a bit of task with bit mask operations. I have modified the script used in my previous post to fetch information from the XML plan by adding additional parameters to fetch information from the cached plans.
The additional query that I am using in this episode of the series is the query shown below other than the attribute information fetched using the DMF mentioned above. The query below gives me the query plan (estimated) and the T-SQL command(s) for the query. Here I used the query to give me information about the TOP duration plan for a single database. The sys.dm_exec_query_stats DMV gives me useful information about the query plans that I am inspecting which can reduce the overhead of collecting profiler traces to gather the execution statistics. However, the execution statistics are available for plans which were cached ONLY.
SELECT TOP 1 a.refcounts,a.usecounts,a.plan_handle,a.cacheobjtype,a.objtype,
DB_NAME(b.dbid) as database_name,OBJECT_NAME(b.objectid,b.dbid) as [object_name],b.query_plan,
c.text,
d.*
FROM sys.dm_exec_cached_plans a
CROSS APPLY sys.dm_exec_query_plan(plan_handle) b
CROSS APPLY sys.dm_exec_sql_text(plan_handle) c
LEFT OUTER JOIN sys.dm_exec_query_stats d
on a.plan_handle = d.plan_handle
WHERE b.dbid = DB_ID(‘<database name>’) — Replace with correct database name
ORDER BY d.total_elapsed_time DESC
The output is shown below:
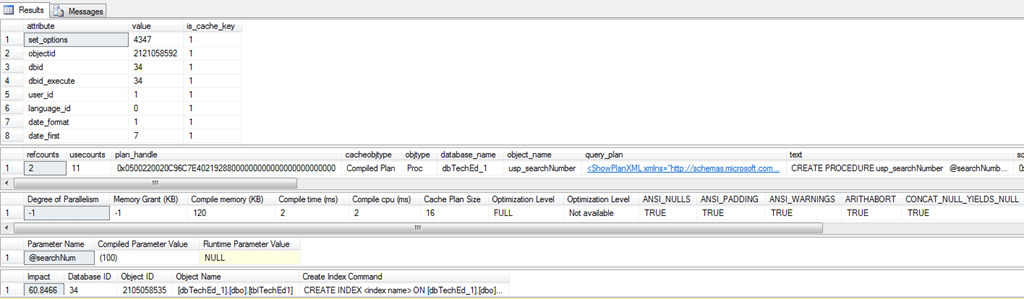
Remember that the query plan obtained is the estimated plan and not the actual execution plan. You can also end up writing canned queries to grab the information from the cached query plans by using queries similar to the following:
SELECT
TOP 5 query_stats.query_hash AS “Query Hash”,
query_stats.query_plan_hash AS “Plan Hash”,
SUM(query_stats.total_worker_time) / SUM(query_stats.execution_count) AS “Avg CPU Time”,
MIN(query_stats.statement_text) AS “Statement Text”,
COUNT(*) AS DistinctQueries
FROM
(SELECT QS.*,
SUBSTRING(ST.text, (QS.statement_start_offset/2) + 1,
((CASE statement_end_offset
WHEN -1 THEN DATALENGTH(ST.text)
ELSE QS.statement_end_offset END
– QS.statement_start_offset)/2) + 1) AS statement_text
FROM sys.dm_exec_query_stats AS QS
CROSS APPLY sys.dm_exec_sql_text(QS.sql_handle) as ST) as query_stats
GROUP BY query_stats.query_hash, query_stats.query_plan_hash
ORDER BY 2 DESC;
The above query gives you all the different queries that were executed which have similar query plan and query text. This can only be used for SQL Server 2008 instances and above as the query plan hash and query hash features are not available in SQL Server 2005 versions and below. Once you have the above output, you can use the query plan hash to get the plan_handle(s) from sys.dm_exec_query_stats DMV output and use the values to get the XML plan and various nuggets of information from the XML using the script below.
/*
This Sample Code is provided for the purpose of illustration only and is not intended to be used in a production environment. THIS SAMPLE CODE AND ANY RELATED INFORMATION ARE PROVIDED "AS IS" WITHOUT WARRANTY OF ANY KIND, EITHER EXPRESSED OR IMPLIED, INCLUDING BUT NOT LIMITED TO THE IMPLIED WARRANTIES OF MERCHANTABILITY AND/OR FITNESS FOR A PARTICULAR PURPOSE. We grant You a nonexclusive, royalty-free right to use and modify the Sample Code and to reproduce and distribute the object code form of the Sample Code, provided that You agree: (i) to not use Our name, logo, or trademarks to market Your software product in which the Sample Code is embedded; (ii) to include a valid copyright notice on Your software product in which the Sample Code is embedded; and (iii) to indemnify, hold harmless, and defend Us and Our suppliers from and against any claims or lawsuits, including attorneys’ fees, that arise or result from the use or distribution of the Sample Code.

Author: Amit Banerjee

Date: April 10, 2012

Description: T-SQL script to fetch plan attribute information, compilation/execution statistics and missing index information from a query plan.

*/

SET NOCOUNT ON

GO

-- Insert XML plan below or modify the query below to fetch the TOP 1 plan based on database and CPU or duration or reads or writes.

-- Replace single quote (') with double quotes ('') using REPLACE option

declare @xmlplan xml = N''

declare @plan_handle varbinary (64)

-- Using CAST, since = operation cannot be used with XML datatypes

IF (CAST(@xmlplan AS varchar(10)) = '')

BEGIN

SELECT TOP 1 @xmlplan=b.query_plan, @plan_handle = d.plan_handle

FROM sys.dm_exec_cached_plans a

CROSS APPLY sys.dm_exec_query_plan(plan_handle) b

LEFT OUTER JOIN sys.dm_exec_query_stats d

on a.plan_handle = d.plan_handle

WHERE b.dbid = DB_ID('dbTechEd_1')

ORDER BY d.total_elapsed_time DESC

END

SELECT attribute,value,is_cache_key FROM sys.dm_exec_plan_attributes(@plan_handle)

SELECT TOP 1 a.refcounts,a.usecounts,a.plan_handle,a.cacheobjtype,a.objtype,

DB_NAME(b.dbid) as database_name,OBJECT_NAME(b.objectid,b.dbid) as [object_name],b.query_plan,

c.text,

d.*

FROM sys.dm_exec_cached_plans a

CROSS APPLY sys.dm_exec_query_plan(plan_handle) b

CROSS APPLY sys.dm_exec_sql_text(plan_handle) c

INNER JOIN sys.dm_exec_query_stats d

on a.plan_handle = d.plan_handle

WHERE b.dbid = DB_ID('dbTechEd_1') -- Replace with correct database name

ORDER BY d.total_elapsed_time DESC

;WITH XMLNAMESPACES ('http://schemas.microsoft.com/sqlserver/2004/07/showplan' AS sp)

SELECT

-- Compilation and execution statistics

-- -- -1 denotes that the value was not found

ISNULL(stmt.stmt_details.value('(./sp:QueryPlan/@DegreeOfParallelism)[1]', 'int'),-1) as [Degree of Parallelism],

-- -1 denotes that the value was not found

ISNULL(stmt.stmt_details.value('(./sp:QueryPlan/@MemoryGrant)[1]', 'bigint'),-1) as [Memory Grant (KB)],

stmt.stmt_details.value('(./sp:QueryPlan/@CompileMemory)[1]', 'bigint') as [Compile memory (KB)],

stmt.stmt_details.value('(./sp:QueryPlan/@CompileTime)[1]', 'bigint') as [Compile time (ms)],

stmt.stmt_details.value('(./sp:QueryPlan/@CompileCPU)[1]', 'bigint') as [Compile cpu (ms)],

stmt.stmt_details.value('(./sp:QueryPlan/@CachedPlanSize)[1]', 'bigint') as [Cache Plan Size],

stmt.stmt_details.value('(../sp:StmtSimple/@StatementOptmLevel)[1]', 'varchar(25)') as [Optimization Level],

ISNULL(stmt.stmt_details.value('(../sp:StmtSimple/@StatementOptmEarlyAbortReason)[1]', 'varchar(50)'),'Not available') as [Optimization Level],

-- SET options

UPPER(stmt.stmt_details.value('(./sp:StatementSetOptions/@ANSI_NULLS)[1]', 'varchar(10)')) as [ANSI_NULLS],

UPPER(stmt.stmt_details.value('(./sp:StatementSetOptions/@ANSI_PADDING)[1]', 'varchar(10)')) as [ANSI_PADDING],

UPPER(stmt.stmt_details.value('(./sp:StatementSetOptions/@ANSI_WARNINGS)[1]', 'varchar(10)')) as [ANSI_WARNINGS],

UPPER(stmt.stmt_details.value('(./sp:StatementSetOptions/@ARITHABORT)[1]', 'varchar(10)')) as [ARITHABORT],

UPPER(stmt.stmt_details.value('(./sp:StatementSetOptions/@CONCAT_NULL_YIELDS_NULL)[1]', 'varchar(10)')) as [CONCAT_NULL_YIELDS_NULL],

UPPER(stmt.stmt_details.value('(./sp:StatementSetOptions/@NUMERIC_ROUNDABORT)[1]', 'varchar(10)')) as [NUMERIC_ROUNDABORT],

UPPER(stmt.stmt_details.value('(./sp:StatementSetOptions/@QUOTED_IDENTIFIER)[1]', 'varchar(10)')) as [QUOTED_IDENTIFIER],

-- The statement text will only be returned for XML plans saved from SSMS GUI

REPLACE (REPLACE (stmt.stmt_details.value('@StatementText', 'nvarchar(max)'), CHAR(10), ' '), CHAR(13), ' ') as [Query Text]

FROM (SELECT @xmlplan as showplan) as p

CROSS APPLY showplan.nodes('//sp:StmtSimple') as stmt (stmt_details)

-- Get the parameter compilation values and runtime values if exists

;WITH XMLNAMESPACES ('http://schemas.microsoft.com/sqlserver/2004/07/showplan' AS sp)

SELECT

stmt.param_details.value('(@Column)[1]', 'varchar(10)') as [Parameter Name],

stmt.param_details.value('(@ParameterCompiledValue)[1]', 'varchar(255)') as [Compiled Parameter Value],

stmt.param_details.value('(@ParameterRuntimeValue)[1]', 'varchar(255)') as [Runtime Parameter Value]

FROM (SELECT @xmlplan as showplan) as p

CROSS APPLY showplan.nodes('//sp:ColumnReference') as stmt (param_details)

--WHERE stmt.stmt_details.value('(@ParameterCompiledValue)[1]', 'varchar(10)') IS NOT NULL

WHERE param_details.exist('@ParameterCompiledValue') = 1

-- Get missing index information if exists

;WITH XMLNAMESPACES (DEFAULT 'http://schemas.microsoft.com/sqlserver/2004/07/showplan')

SELECT

n.value('(//MissingIndexGroup/@Impact)[1]', 'FLOAT') AS [Impact],

DB_ID(REPLACE(REPLACE(n.value('(//MissingIndex/@Database)[1]', 'VARCHAR(128)'),'[',''),']','')) AS [Database_ID],

OBJECT_ID(n.value('(//MissingIndex/@Database)[1]', 'VARCHAR(128)') + '.' + n.value('(//MissingIndex/@Schema)[1]', 'VARCHAR(128)') + '.' + n.value('(//MissingIndex/@Table)[1]', 'VARCHAR(128)')) AS [OBJECT_id],

n.value('(//MissingIndex/@Database)[1]', 'VARCHAR(128)') + '.' + n.value('(//MissingIndex/@Schema)[1]', 'VARCHAR(128)') + '.' + n.value('(//MissingIndex/@Table)[1]', 'VARCHAR(128)') AS [Object],

'CREATE INDEX <ncidx_<name> ON ' + n.value('(//MissingIndex/@Database)[1]', 'VARCHAR(128)') + '.' +

n.value('(//MissingIndex/@Schema)[1]', 'VARCHAR(128)') + '.' + n.value('(//MissingIndex/@Table)[1]', 'VARCHAR(128)') + ' ( ' +

-- Equality list

(SELECT DISTINCT c.value('(@Name)[1]', 'VARCHAR(128)')

FROM n.nodes('//ColumnGroup') AS t(cg)

CROSS APPLY cg.nodes('Column') AS r(c)

WHERE cg.value('(@Usage)[1]', 'VARCHAR(128)') = 'EQUALITY'

FOR XML PATH('')

) AS equality_columns,

-- Inequality list

(SELECT DISTINCT c.value('(@Name)[1]', 'VARCHAR(128)')

FROM n.nodes('//ColumnGroup') AS t(cg)

CROSS APPLY cg.nodes('Column') AS r(c)

WHERE cg.value('(@Usage)[1]', 'VARCHAR(128)') = 'INEQUALITY'

FOR XML PATH('')

) AS inequality_columns,

-- Included column list

(SELECT DISTINCT c.value('(@Name)[1]', 'VARCHAR(128)') + ', '

FROM n.nodes('//ColumnGroup') AS t(cg)

CROSS APPLY cg.nodes('Column') AS r(c)

WHERE cg.value('(@Usage)[1]', 'VARCHAR(128)') = 'INCLUDE'

FOR XML PATH('')

) AS include_columns

INTO #MissingIndexes

FROM (SELECT @xmlplan as showplan) AS tab (query_plan)

CROSS APPLY query_plan.nodes('//StmtSimple') AS q(n)

WHERE n.exist('QueryPlan/MissingIndexes') = 1

IF EXISTS (SELECT TOP 1 impact FROM #MissingIndexes)

BEGIN

-- Get rid of trailing commas

UPDATE #MissingIndexes

SET equality_columns = LEFT(equality_columns,LEN(equality_columns)-1),

inequality_columns = LEFT(inequality_columns,LEN(inequality_columns)-1),

include_columns = LEFT(include_columns,LEN(include_columns)-1)

-- Display the missing index information

SELECT Impact, Database_ID as [Database ID], OBJECT_id as [Object ID], OBJECT as [Object Name],

'CREATE INDEX <index name>' + ' ON '+ OBJECT + ' (' + ISNULL (equality_columns,'') + CASE WHEN equality_columns IS NOT NULL AND inequality_columns IS NOT NULL THEN ',' ELSE '' END + ISNULL (inequality_columns, '') + ')' + ISNULL (' INCLUDE (' + include_columns + ')', '')

AS [Create Index Command]

FROM #MissingIndexes

END

DROP TABLE #MissingIndexes

GO

SET NOCOUNT OFF

GO
As you have noticed, this is Part 1 of breaking dawn… The last post on the XML Plans Saga will be Breaking Dawn Part 2 and stay tuned for some more fun with XML plans in that post.

